Dataset
Data Collection and Annotation
Split
18 train · 4 val · 4 test
Scanner
ZEB Horizon
Features
XYZ · RGB · Int · GPS
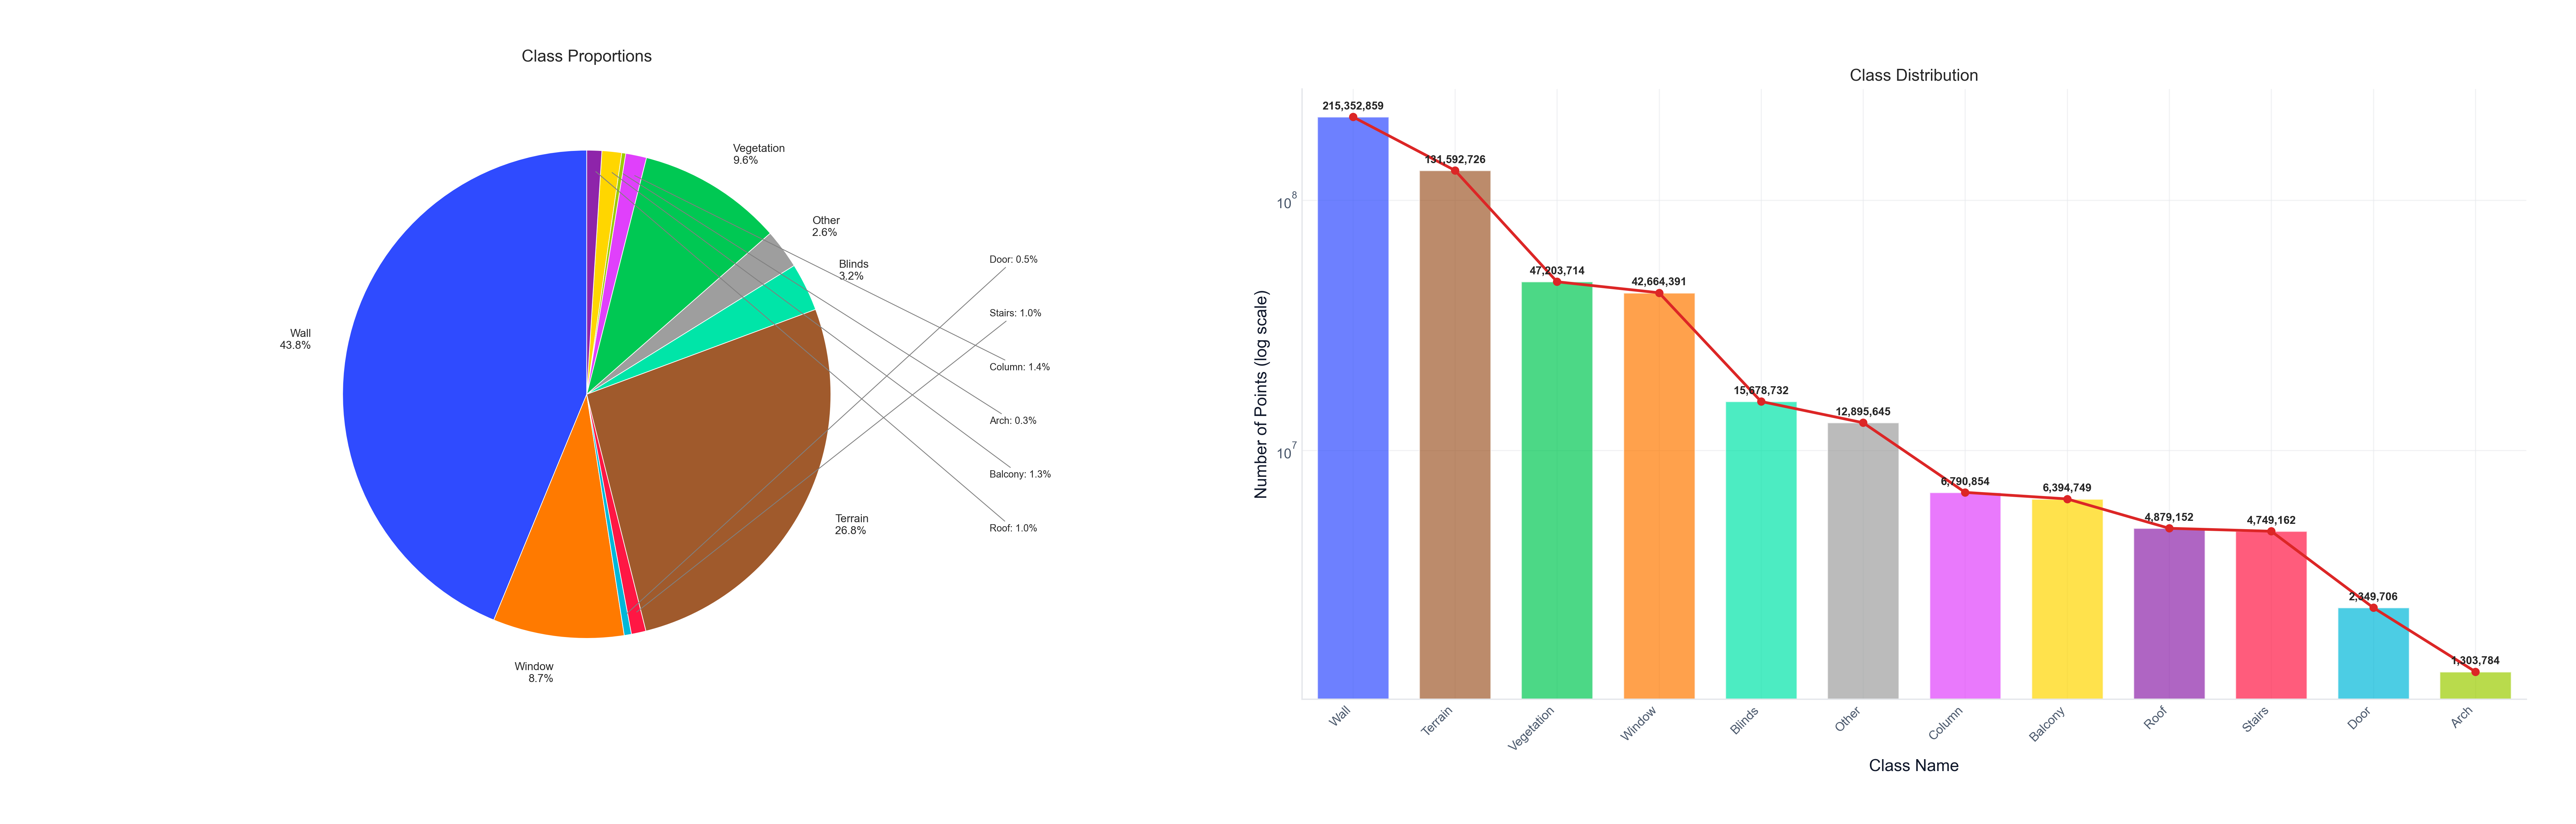
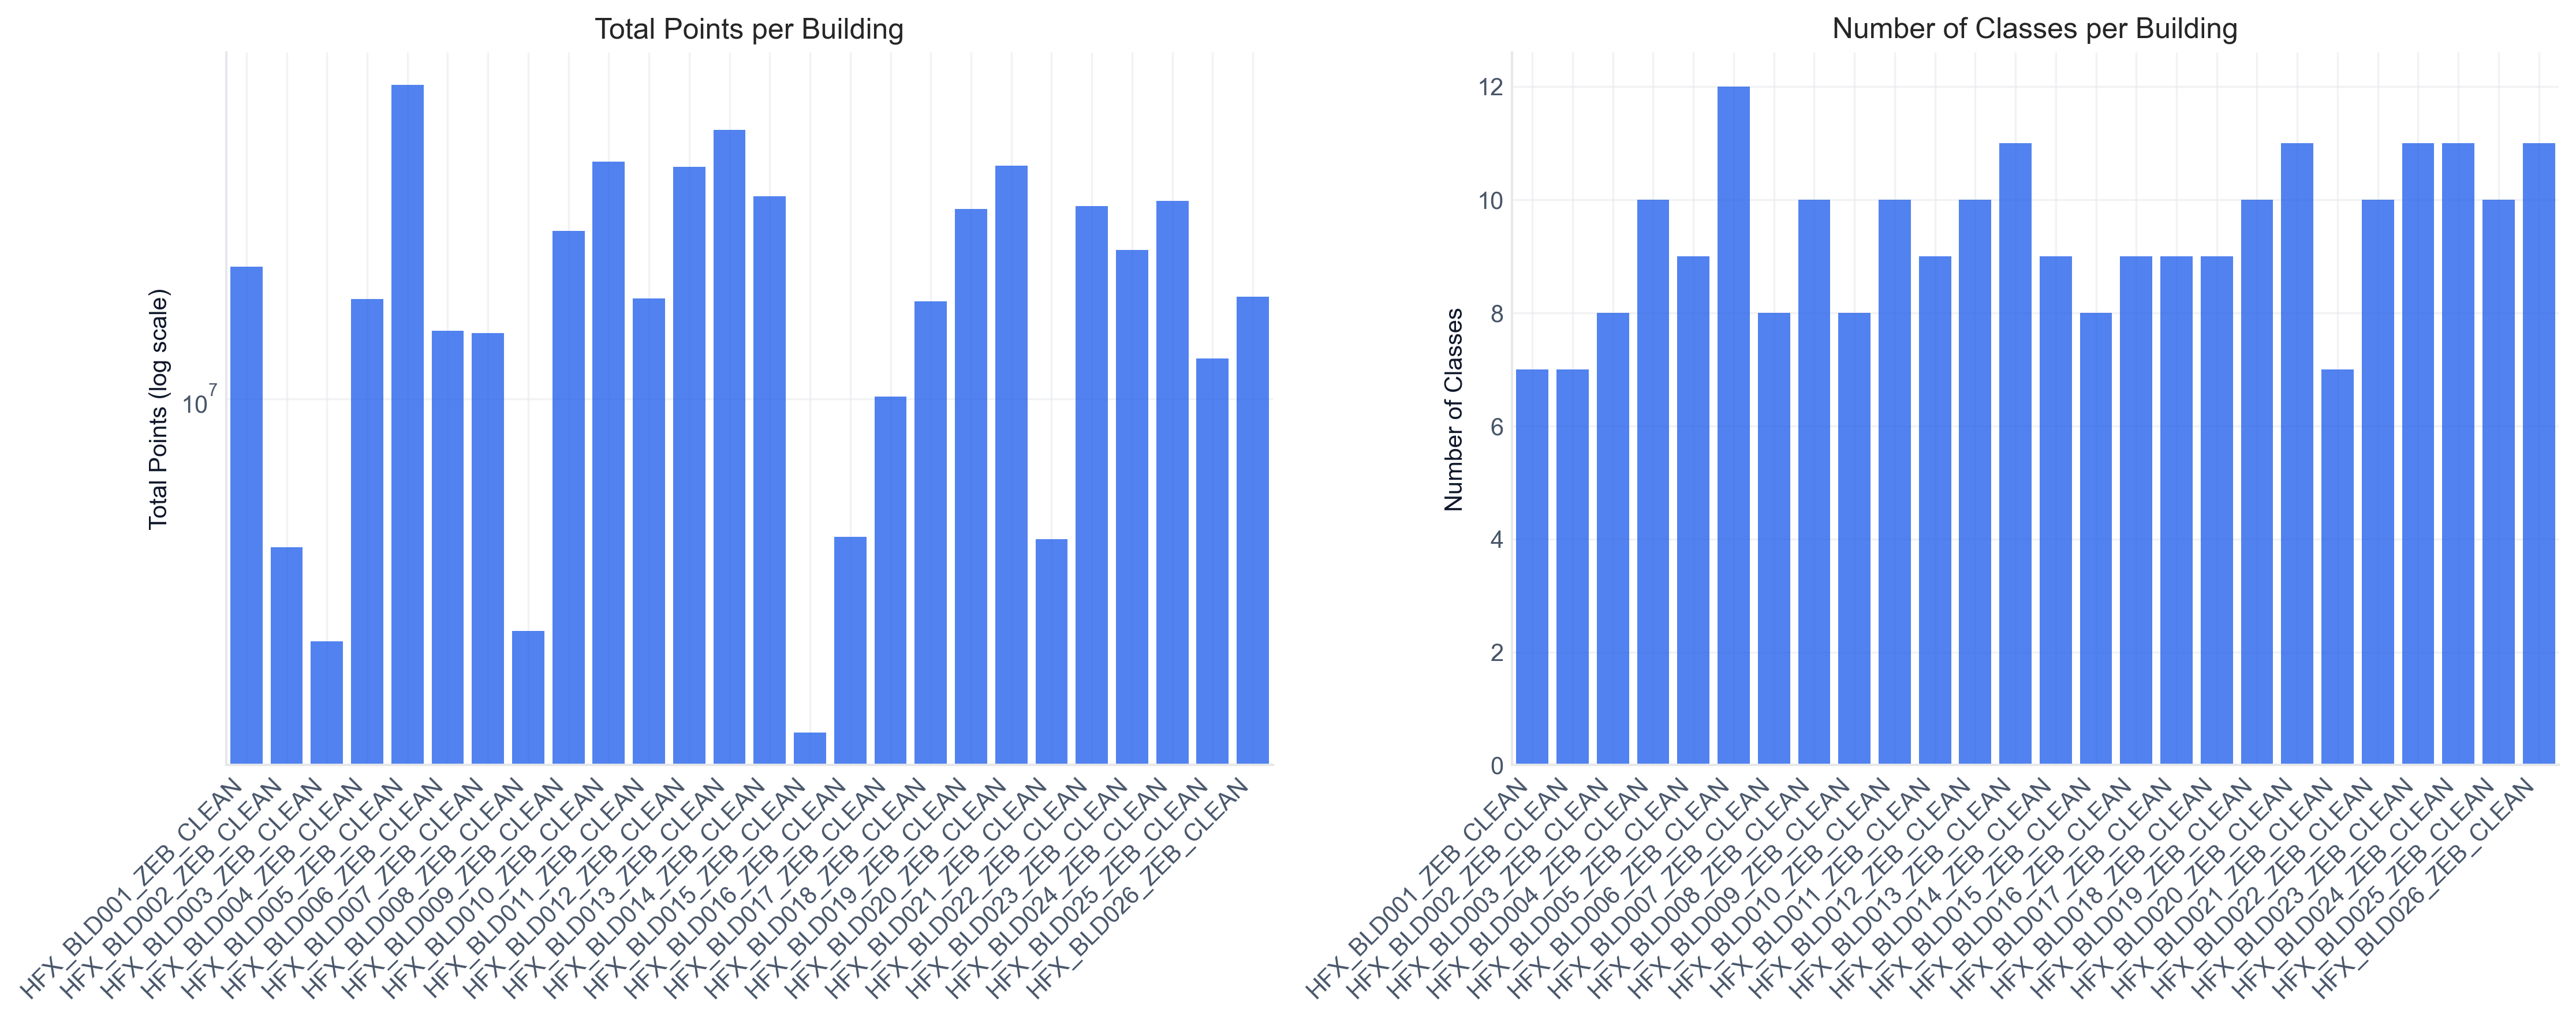
Dataset Statistics
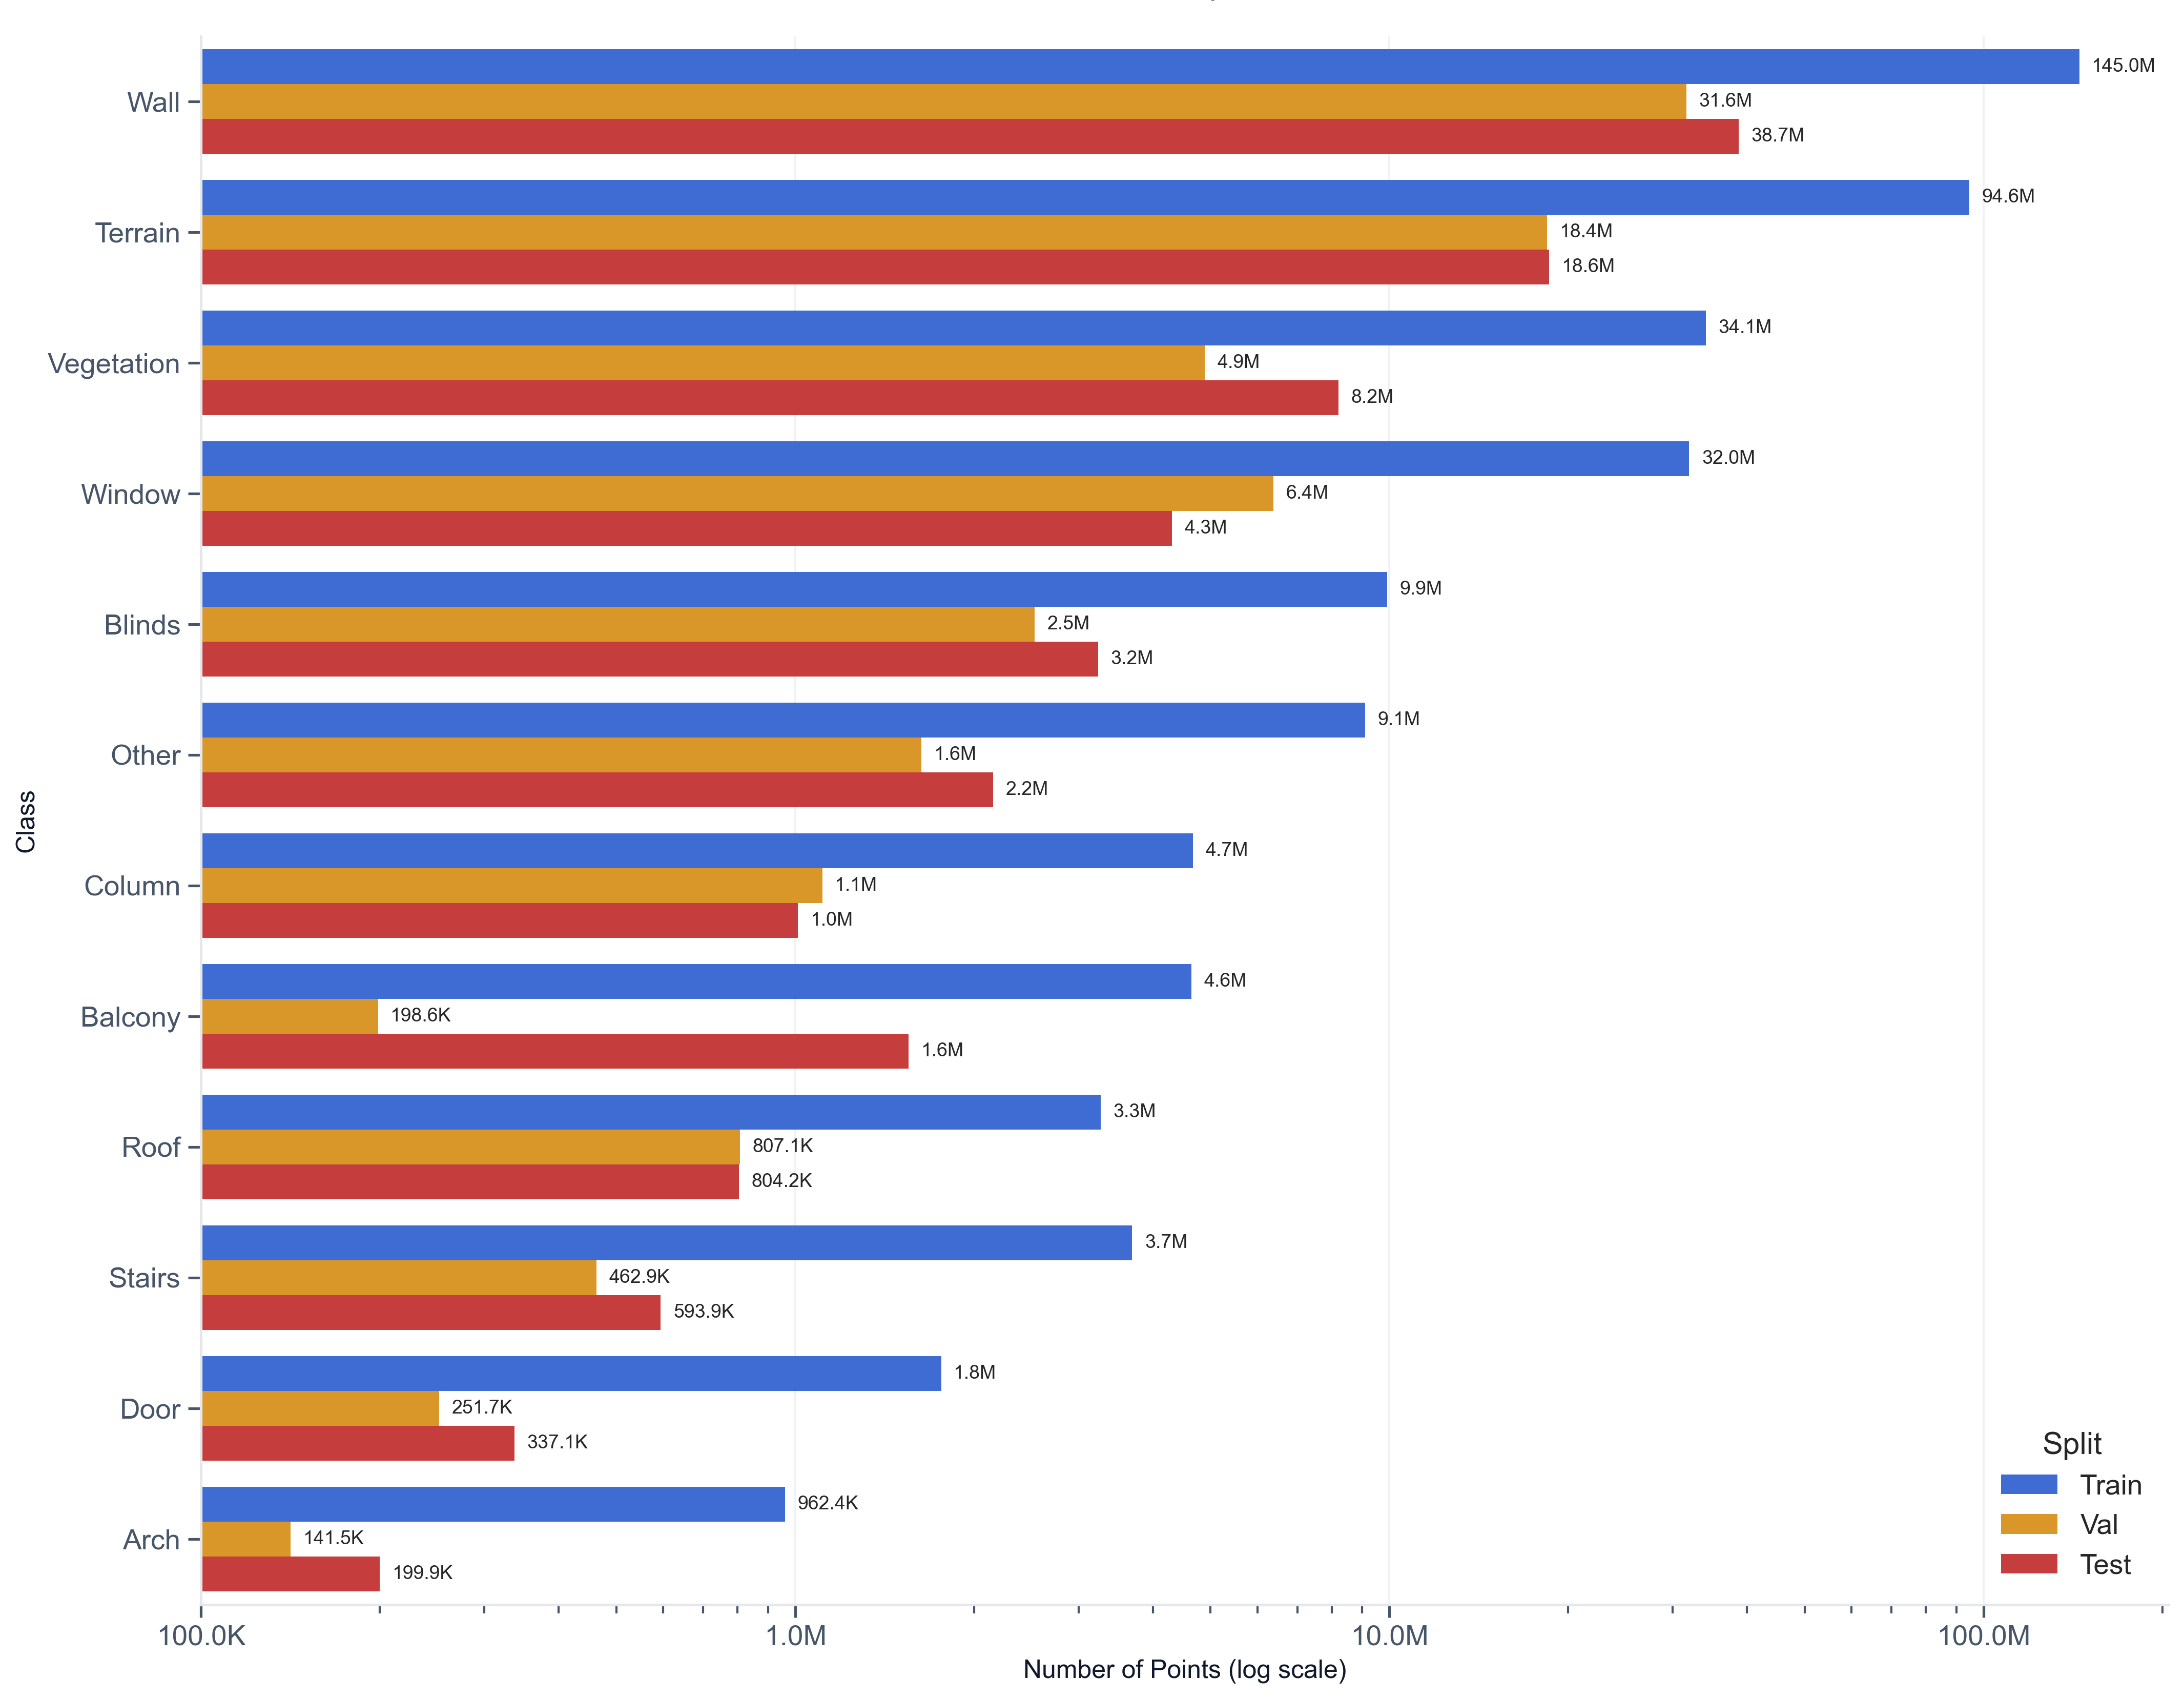
Class Balance
Points & Classes per Building
Per-Class Split
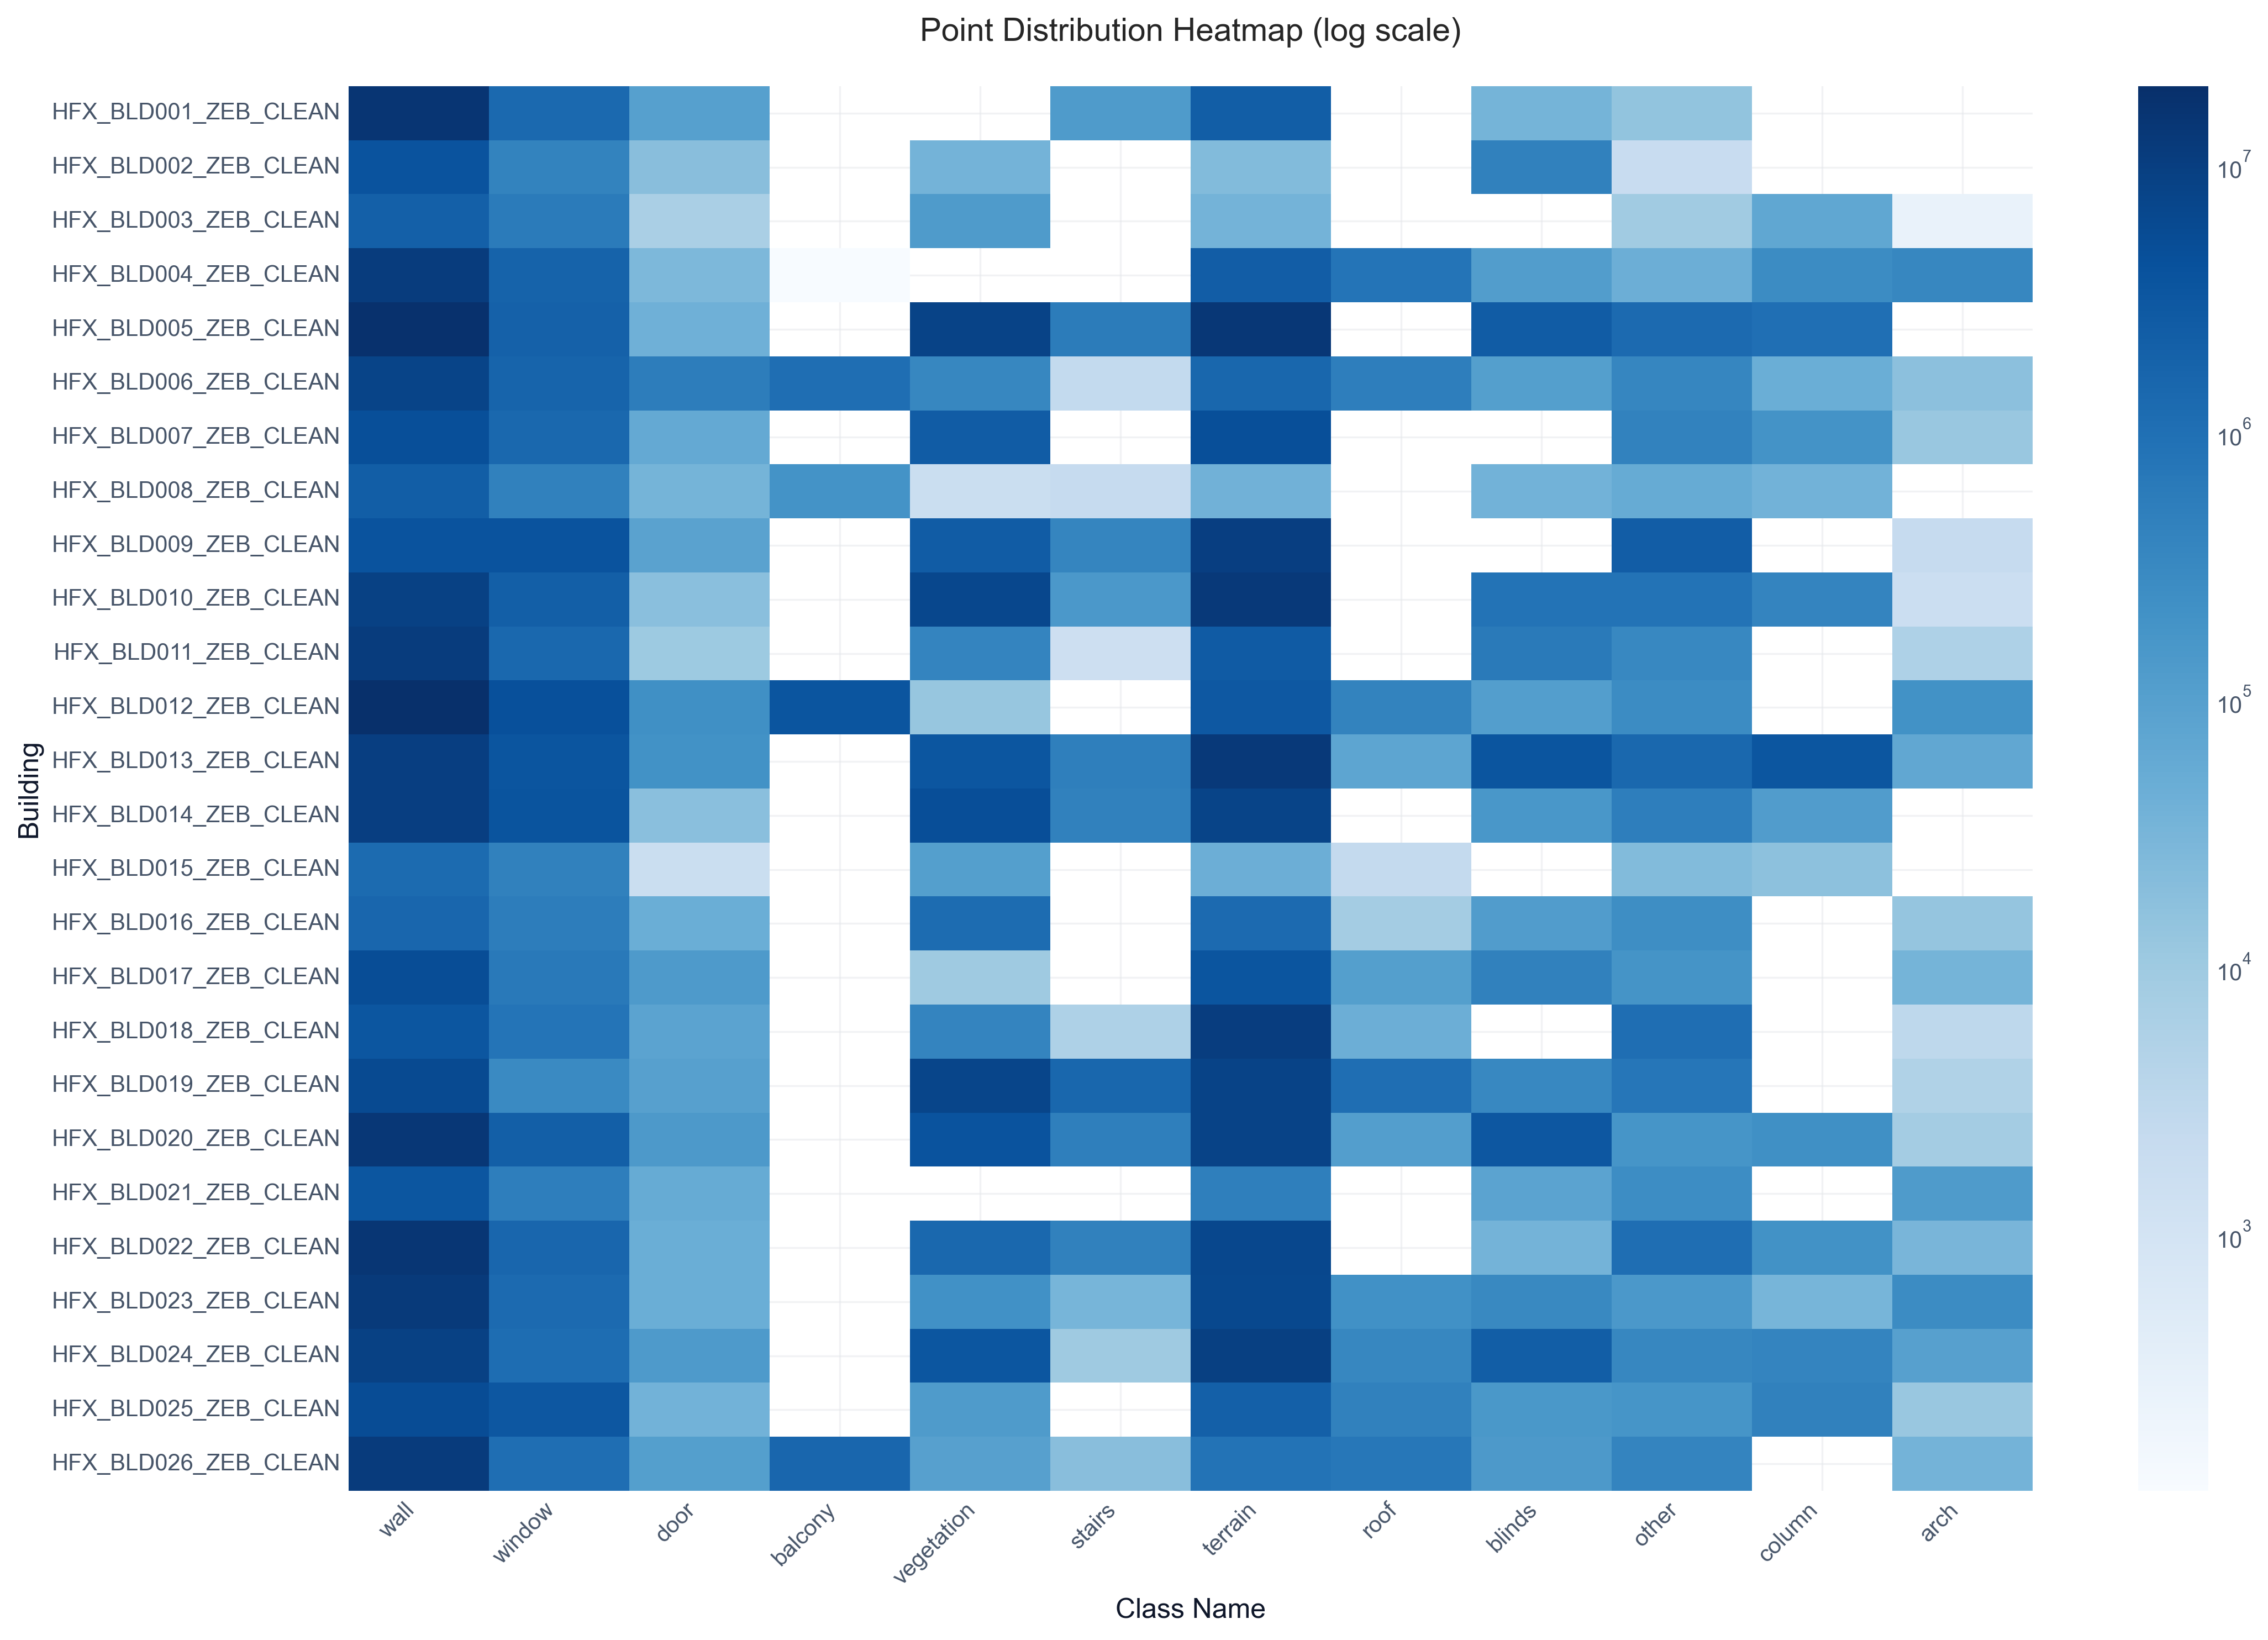
Building × Class Heatmap
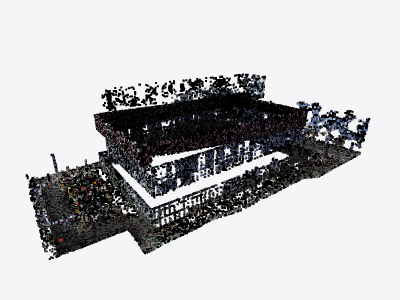
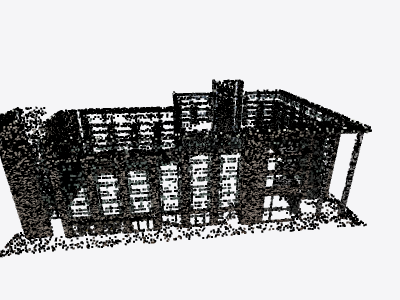
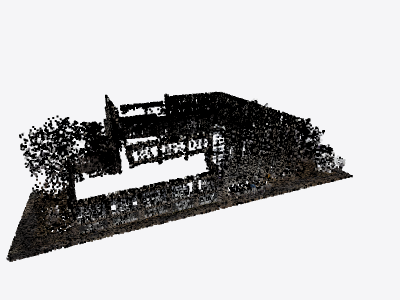
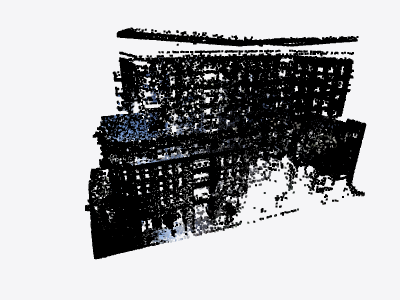
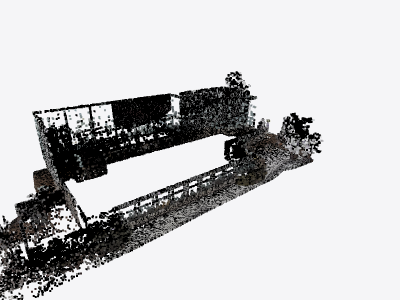
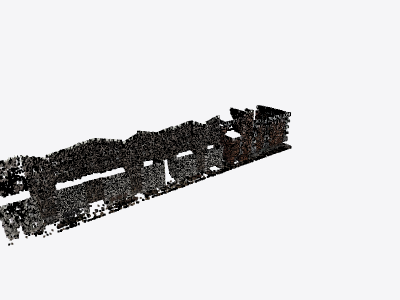
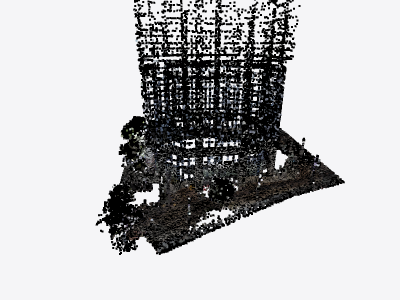
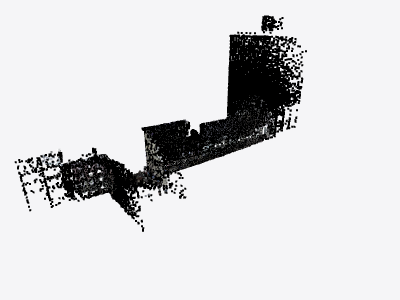
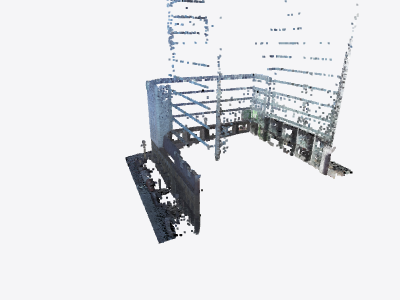
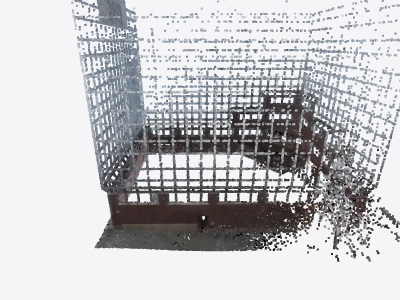
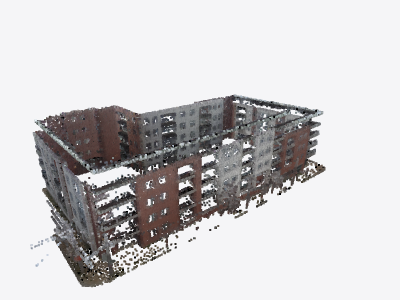
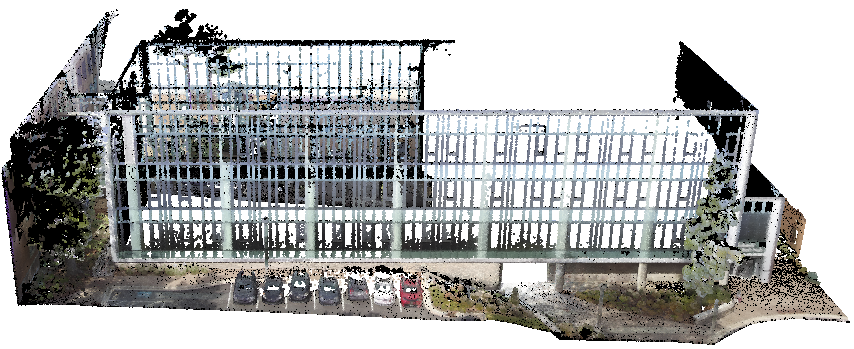
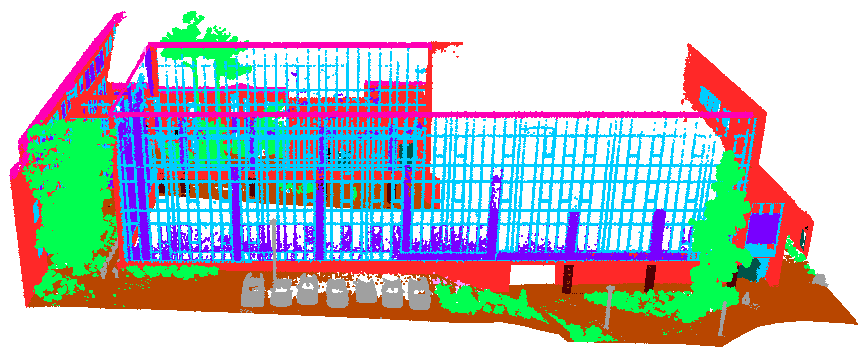
RGB & Semantic Annotation
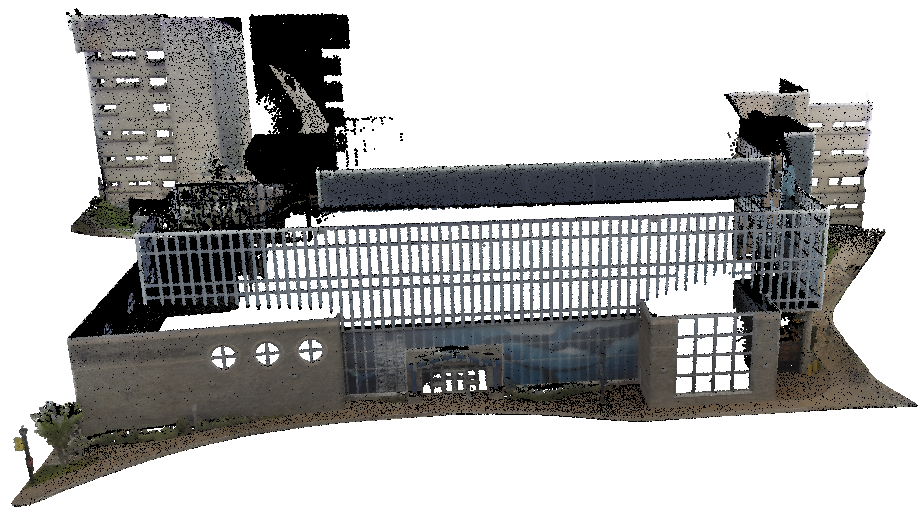
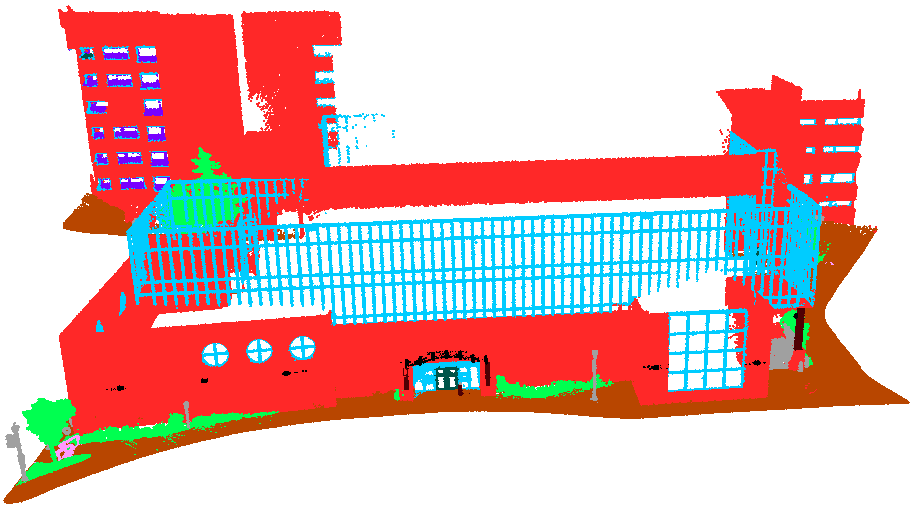
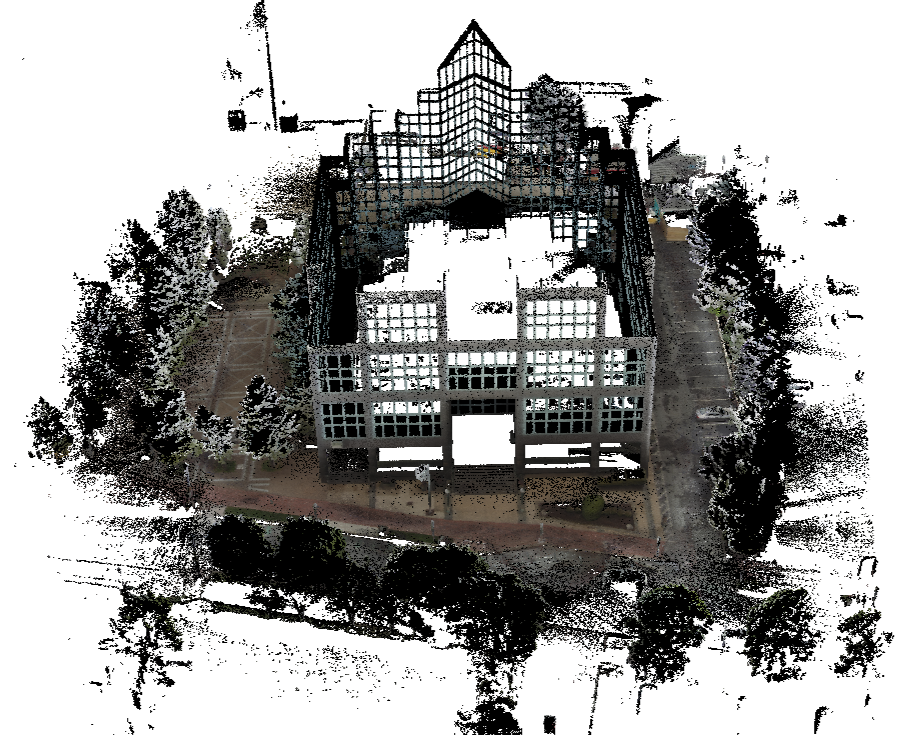
BLD006 · VIC Suites
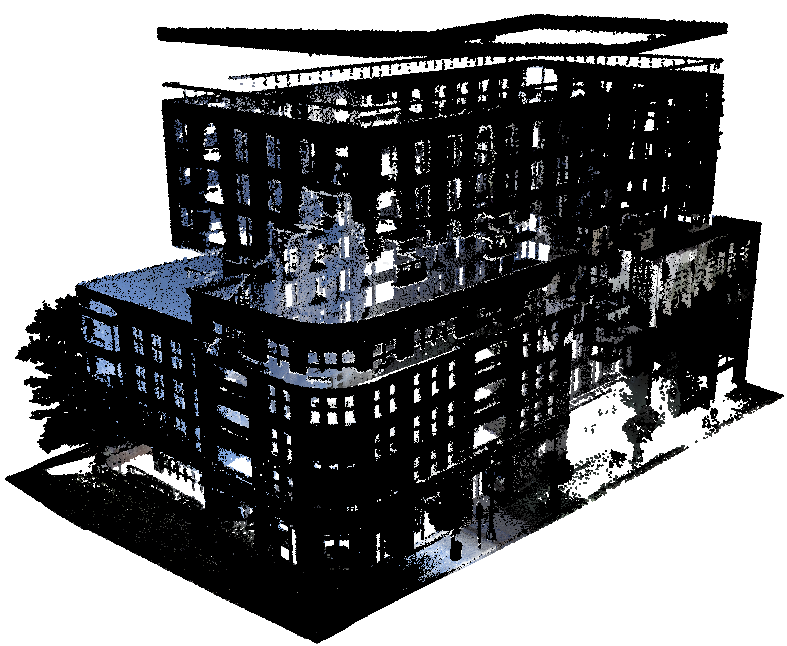 RGB
RGB
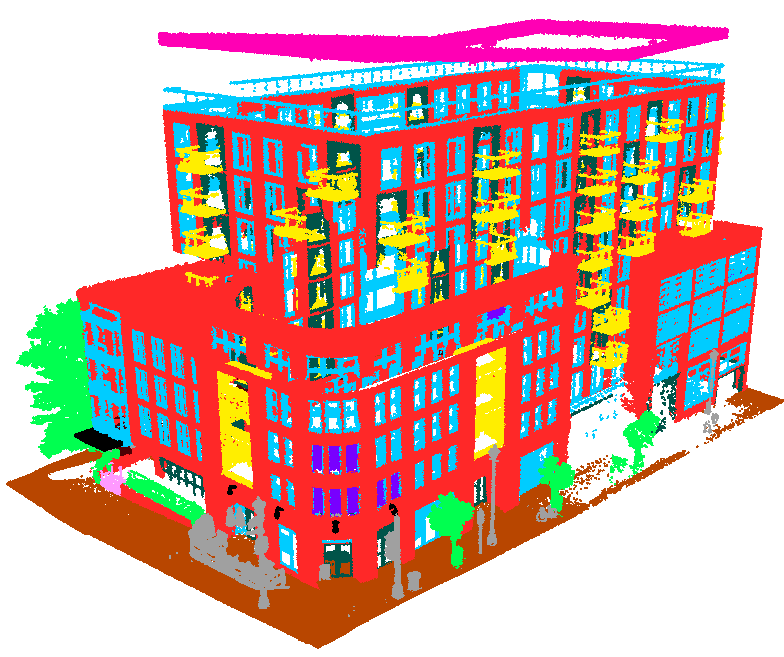 Semantic
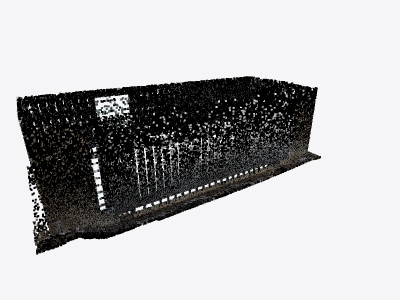
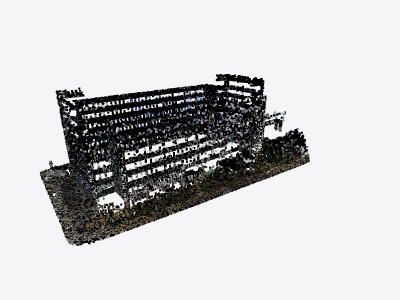
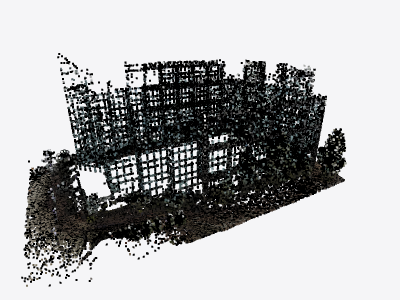
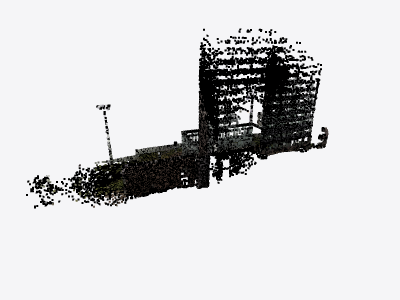
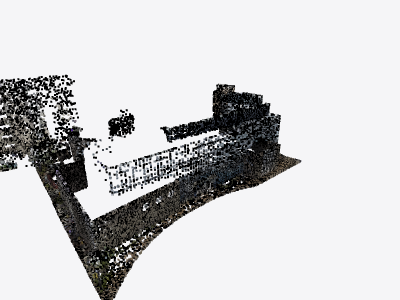
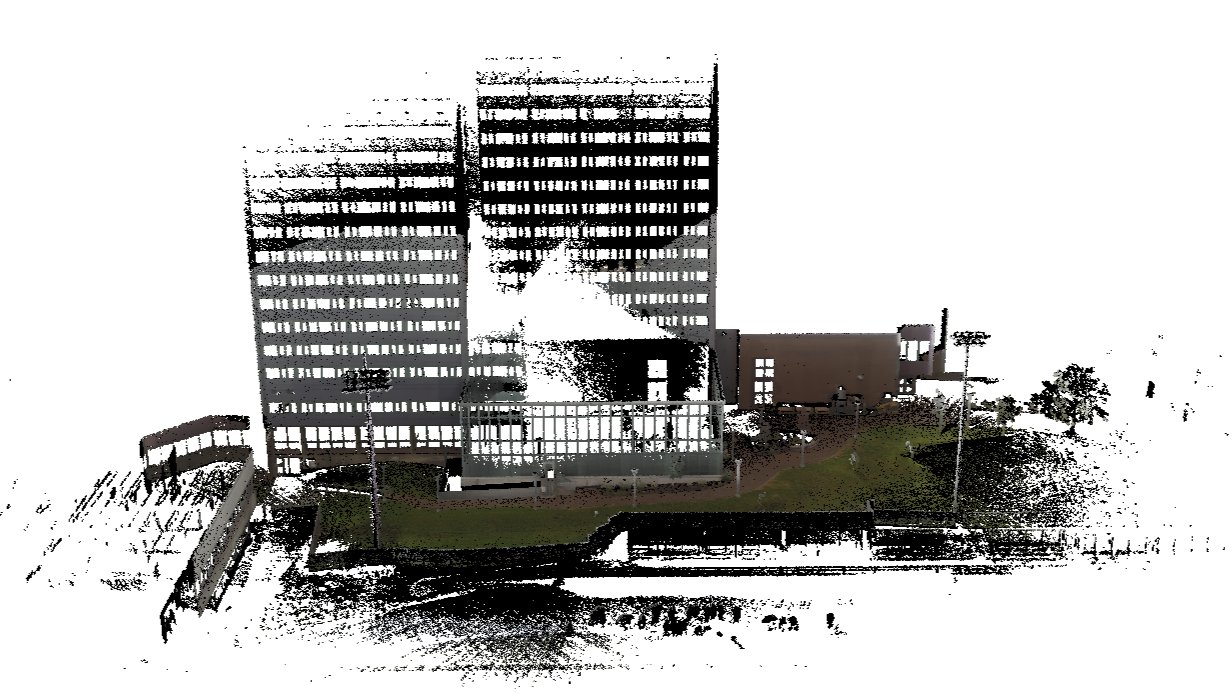
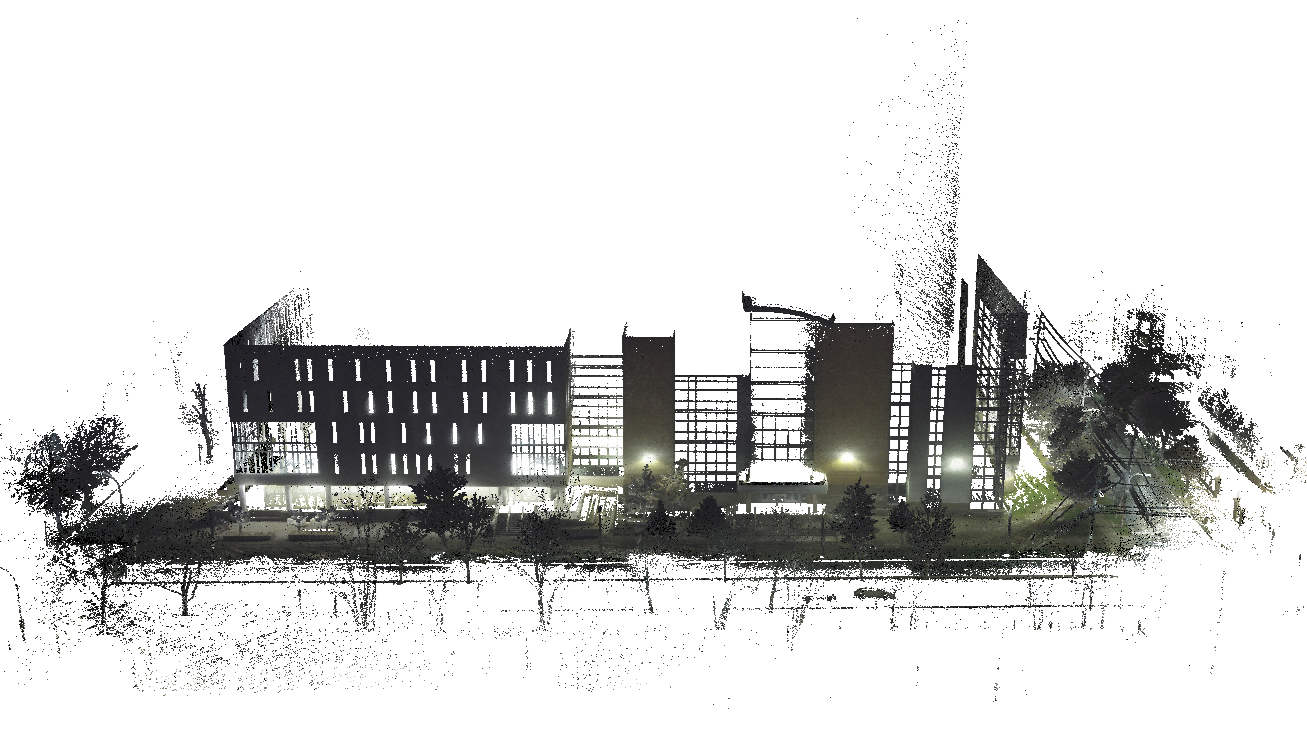
BLD017 · 1801 Hollis (Sidewalk)
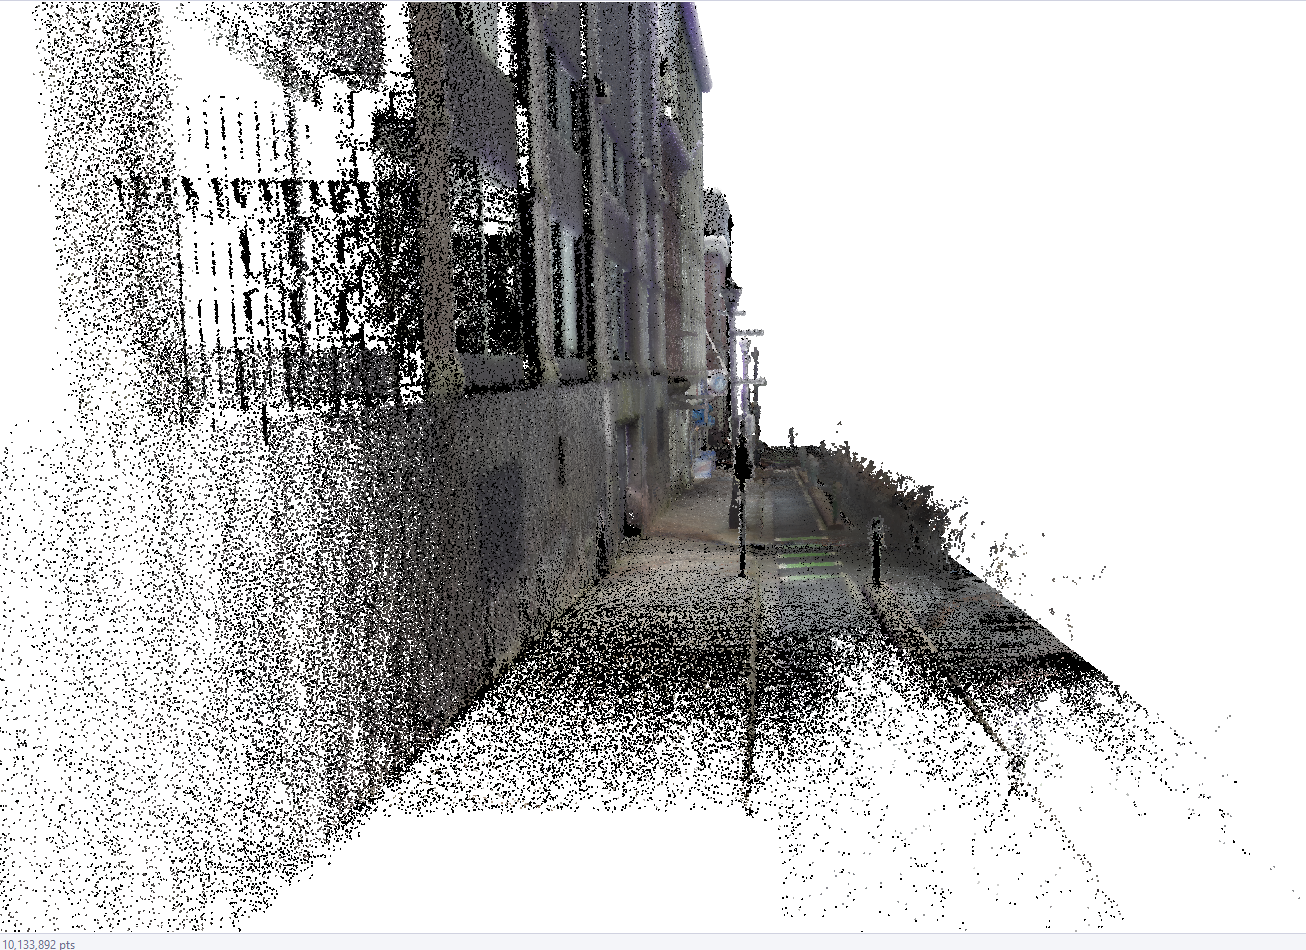 RGB
RGB
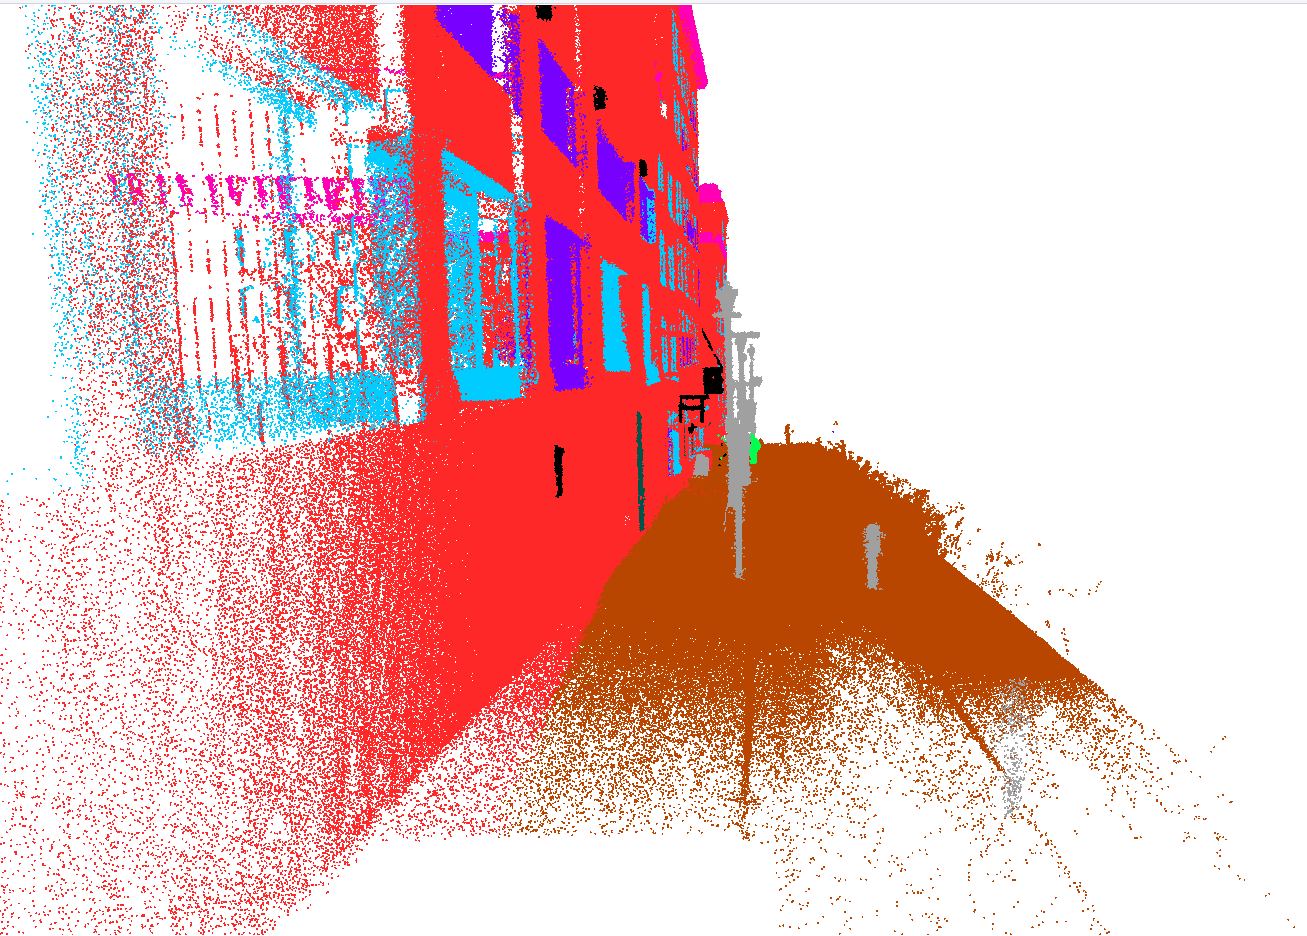 Semantic
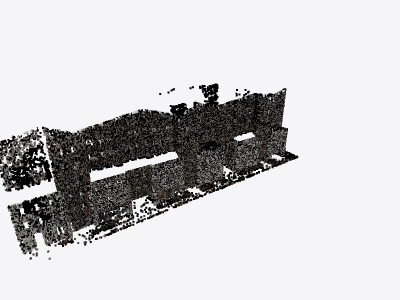
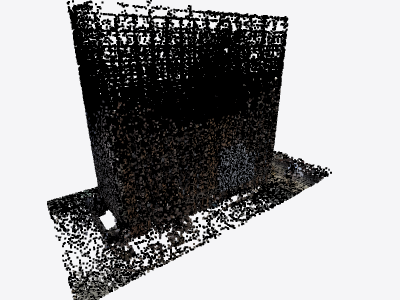
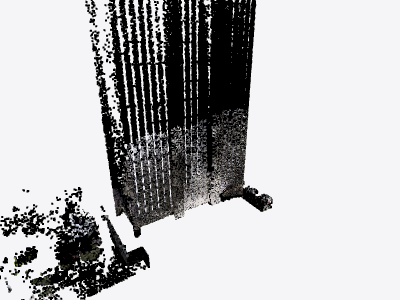
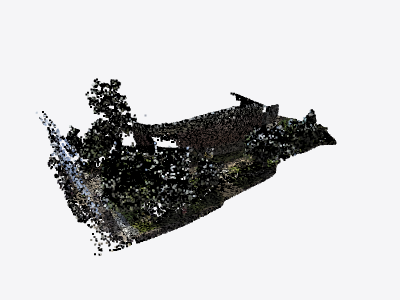
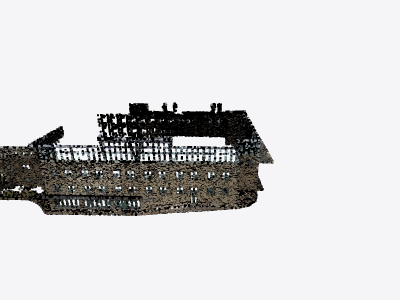
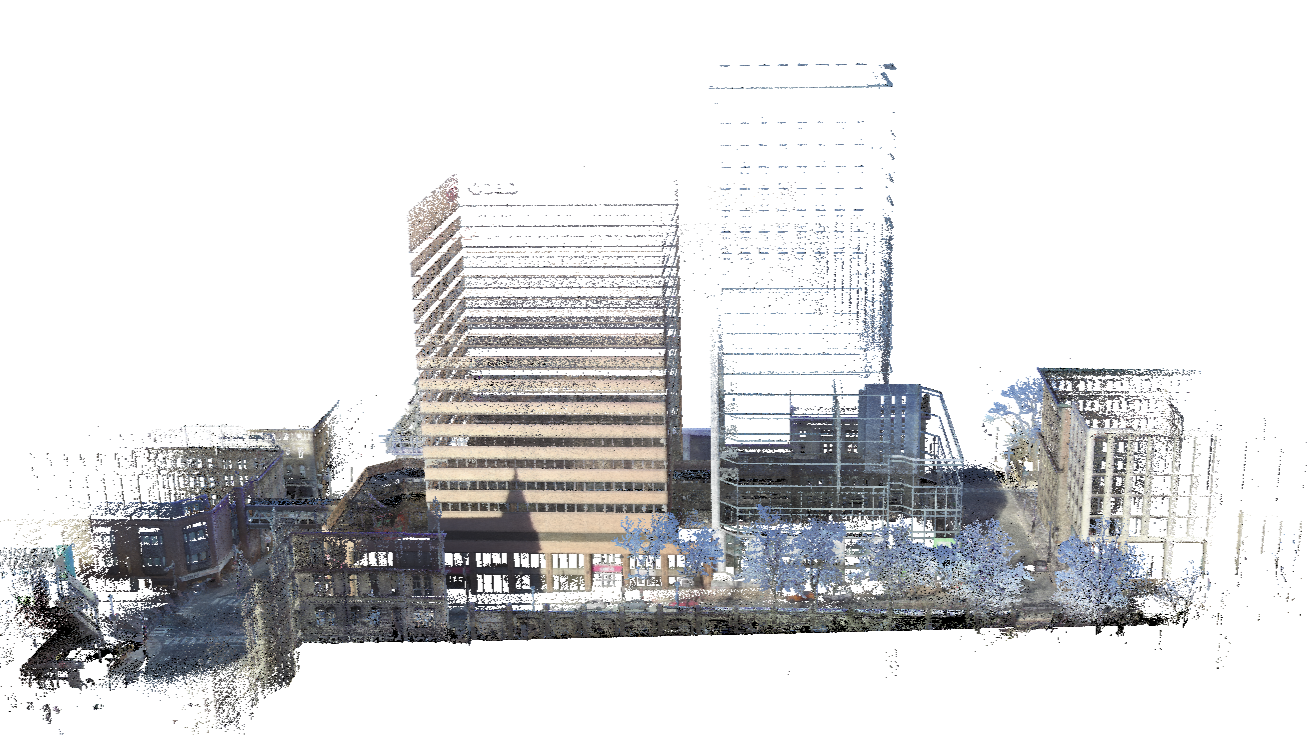
BLD022 · Steele Ocean 1
 RGB
RGB
 Semantic
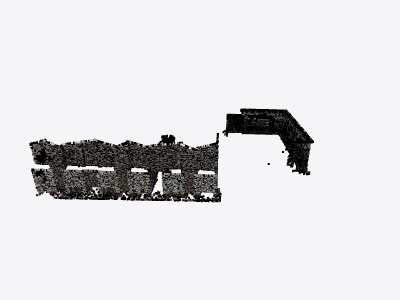
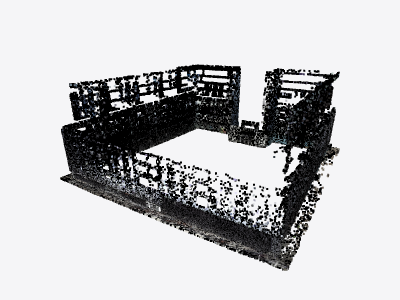
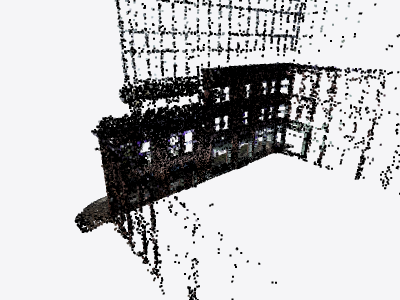
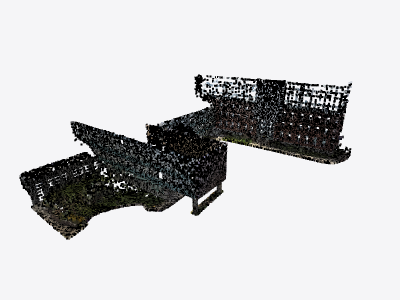
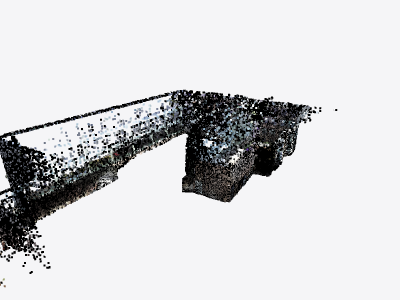
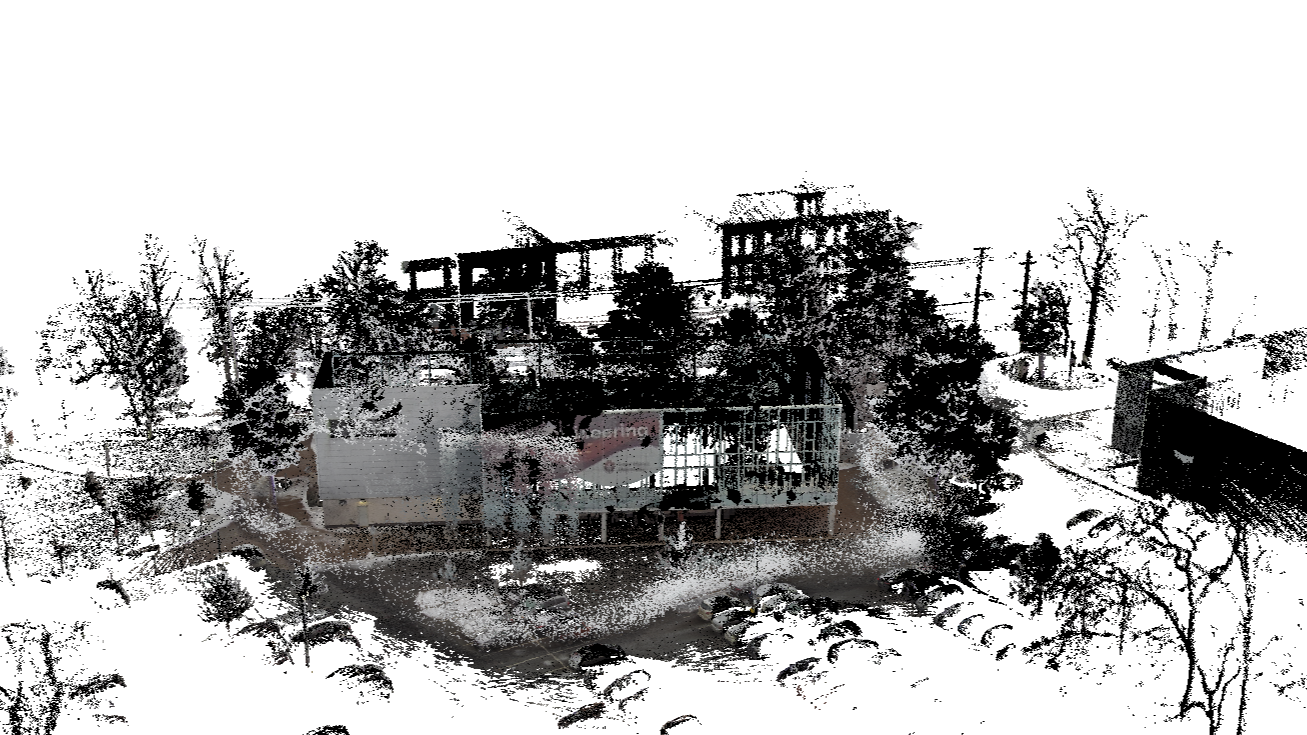
BLD024 · Sobeys Hub
 RGB
RGB
 Semantic
12-Class Taxonomy
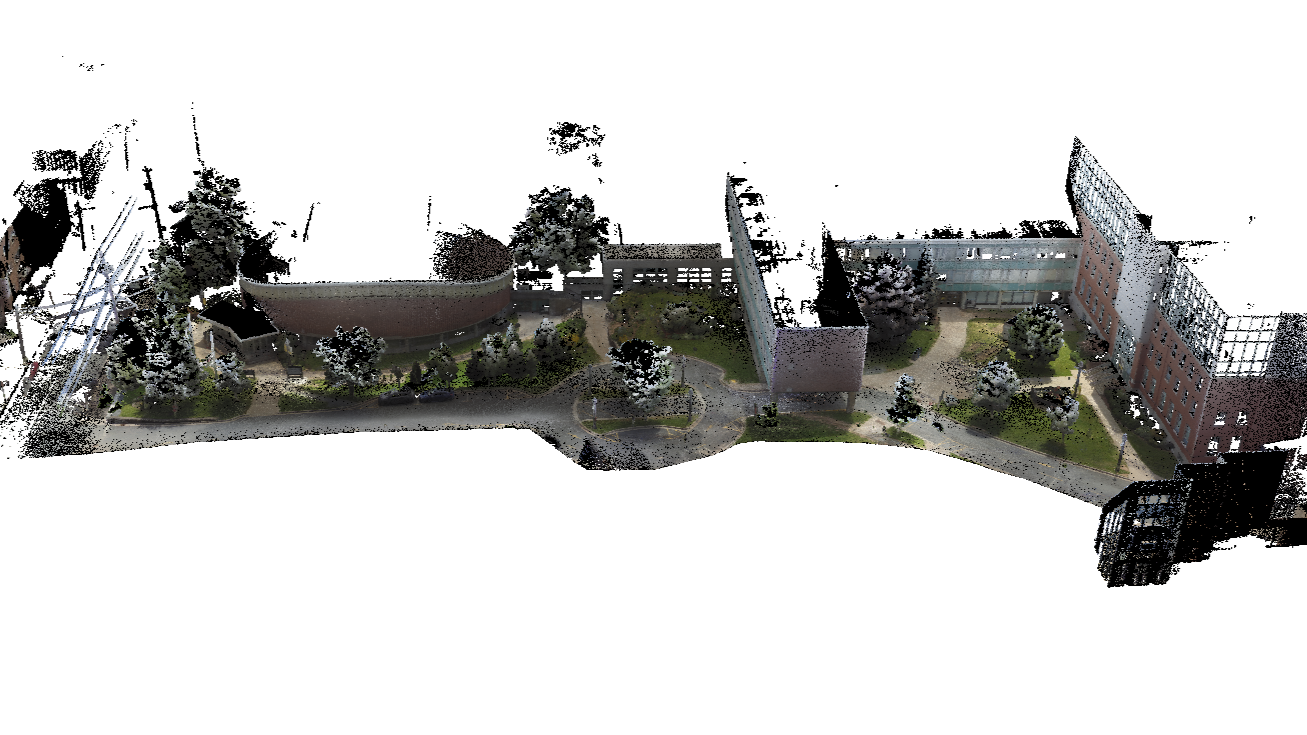
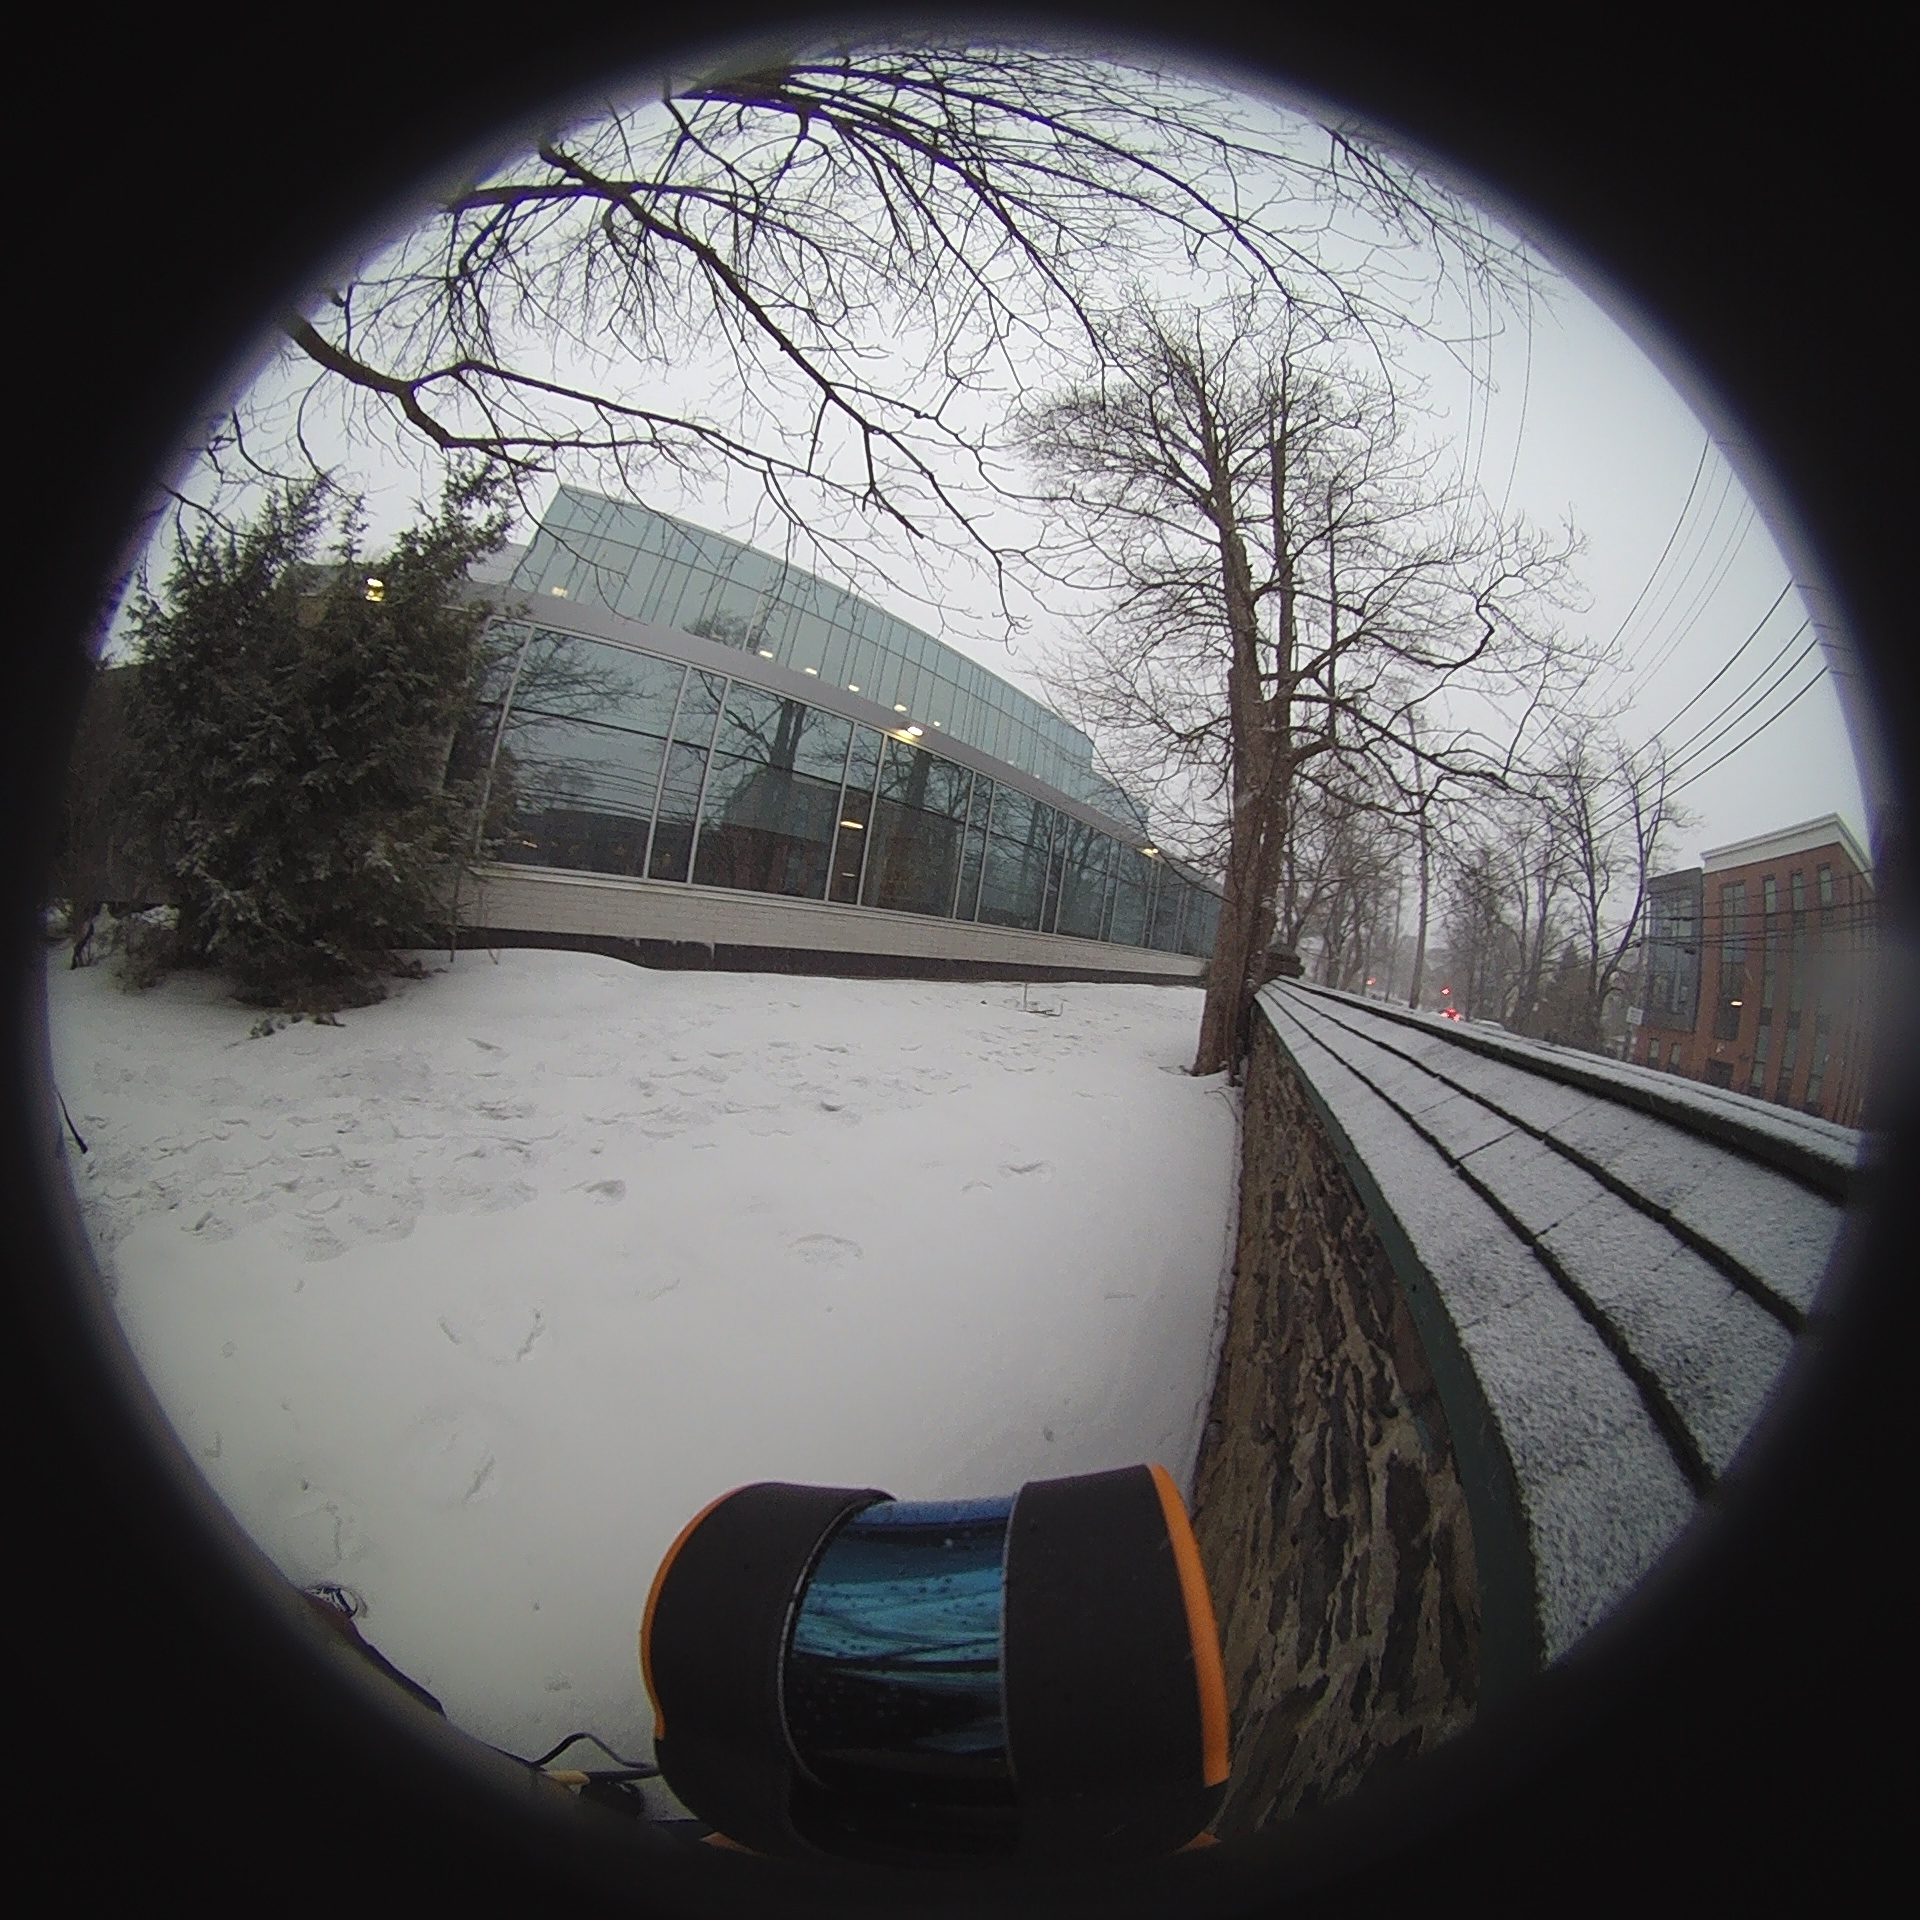
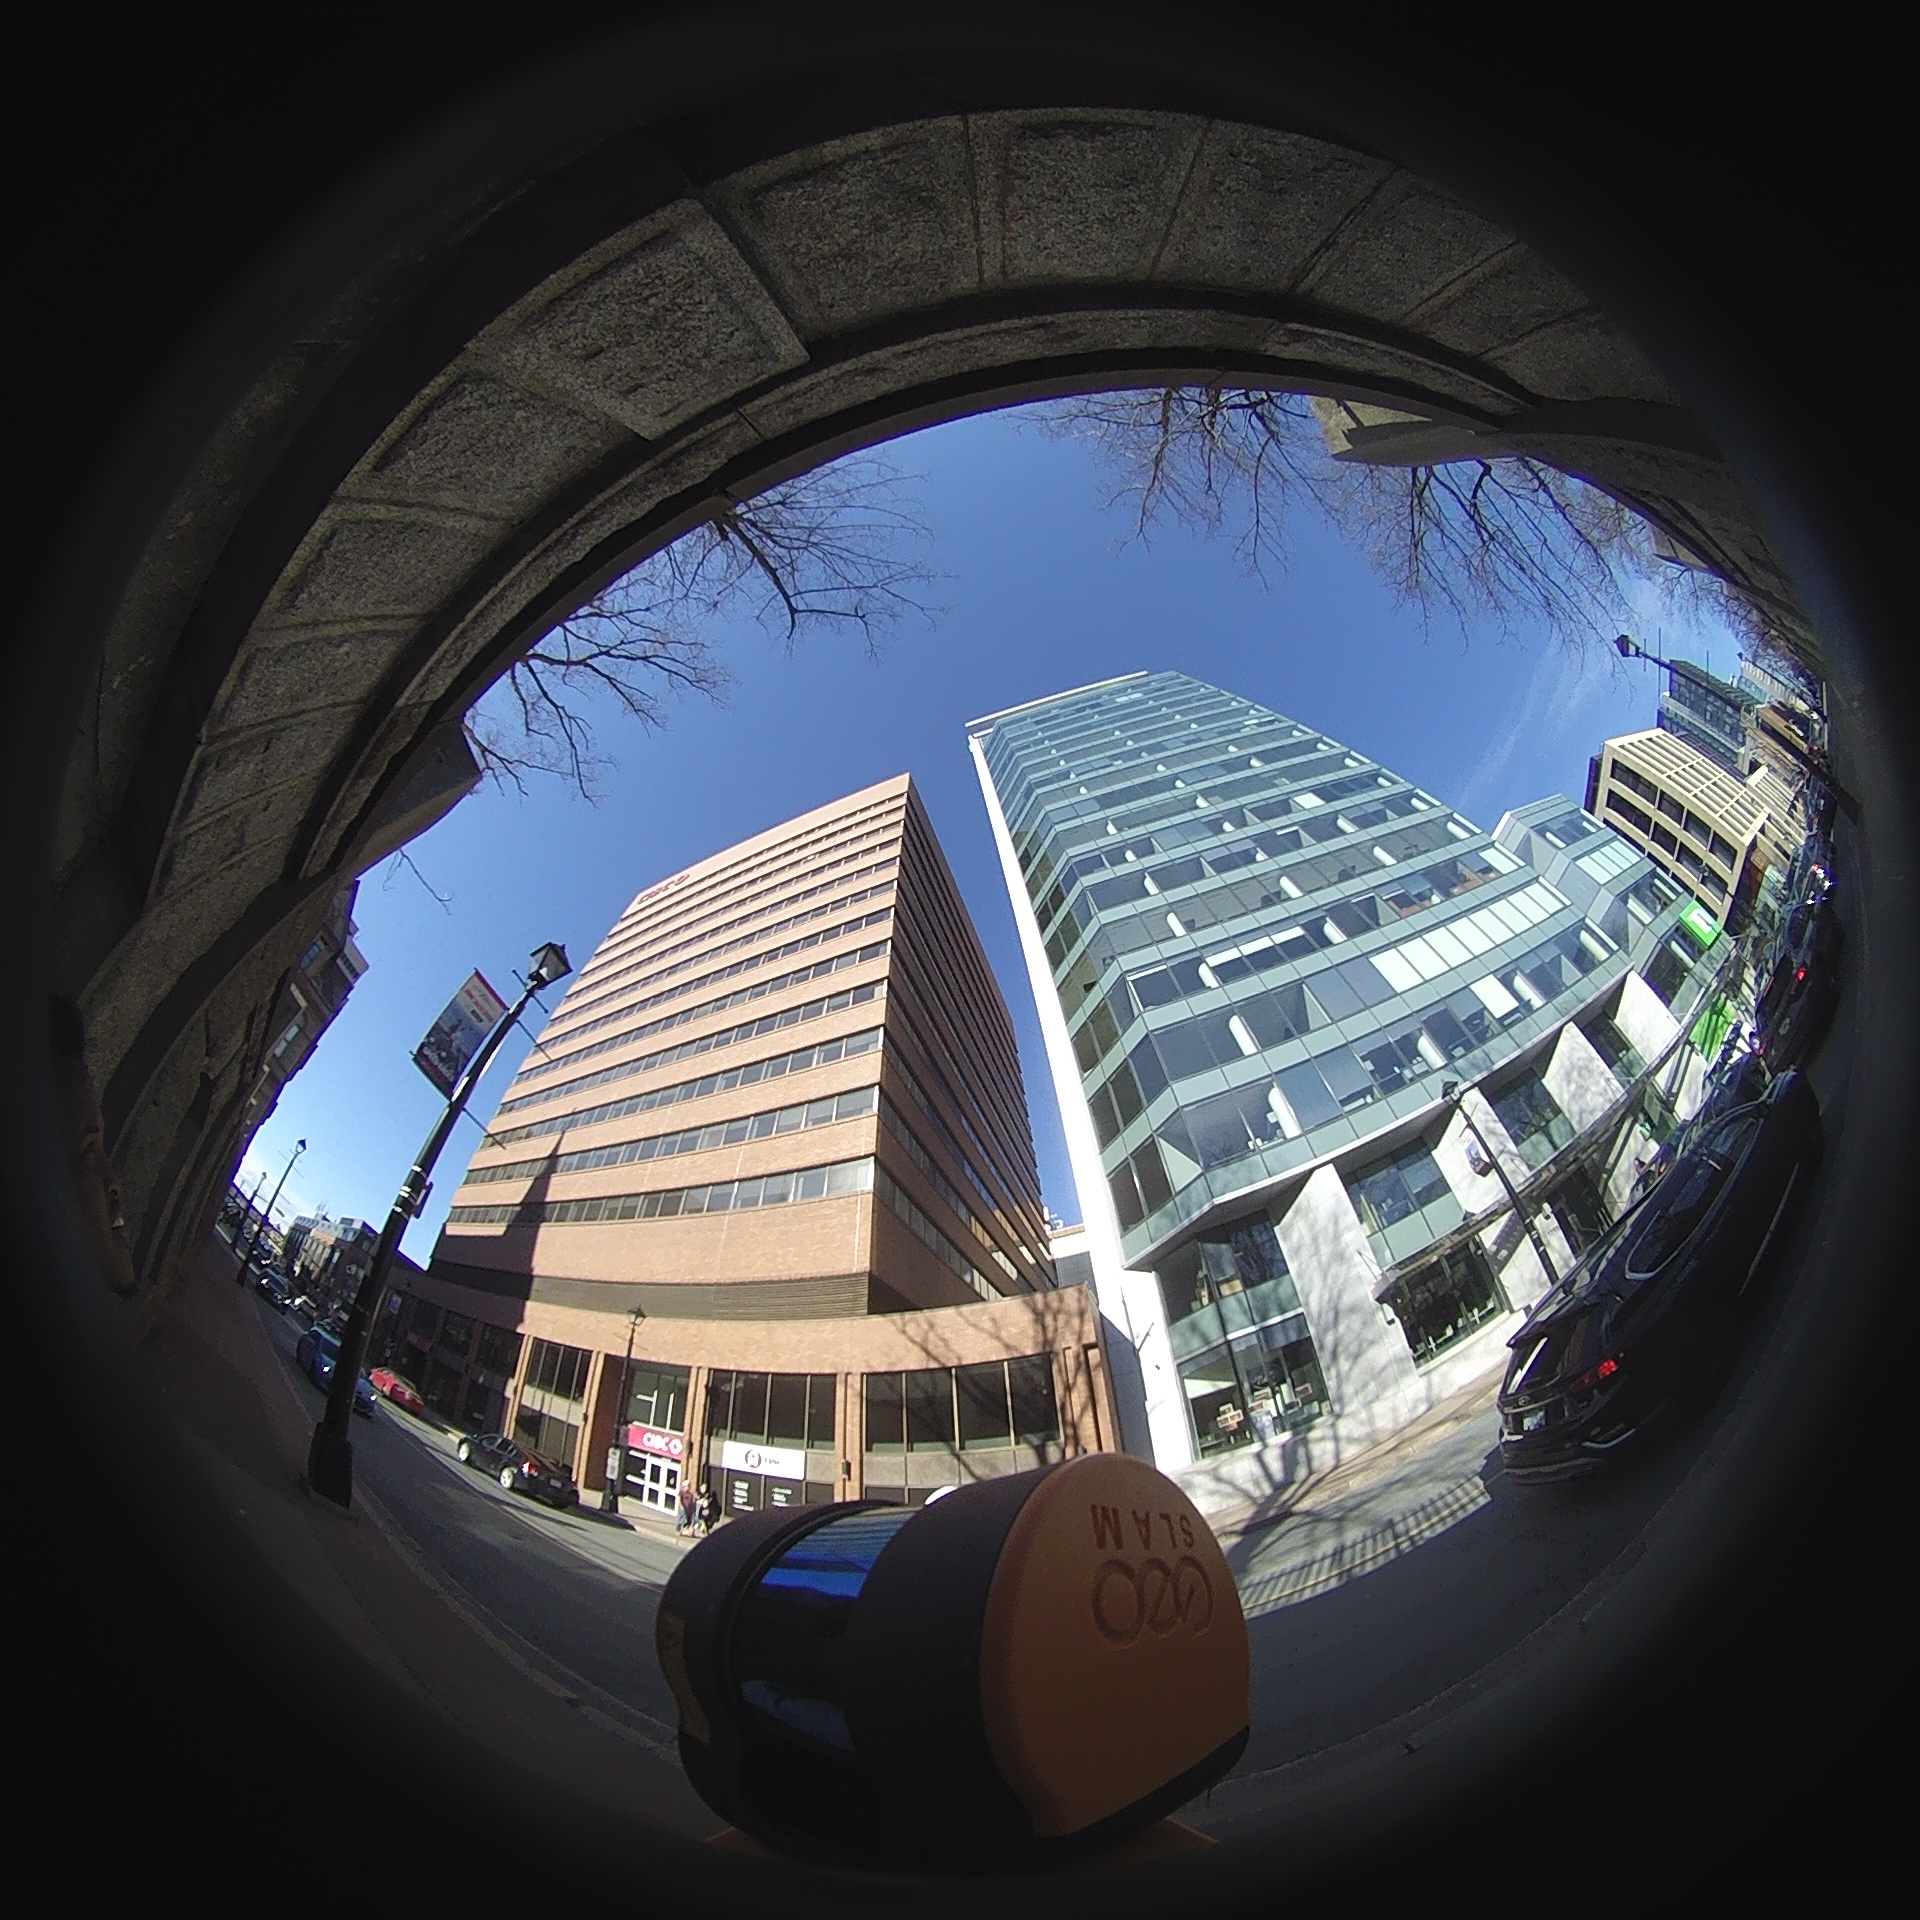
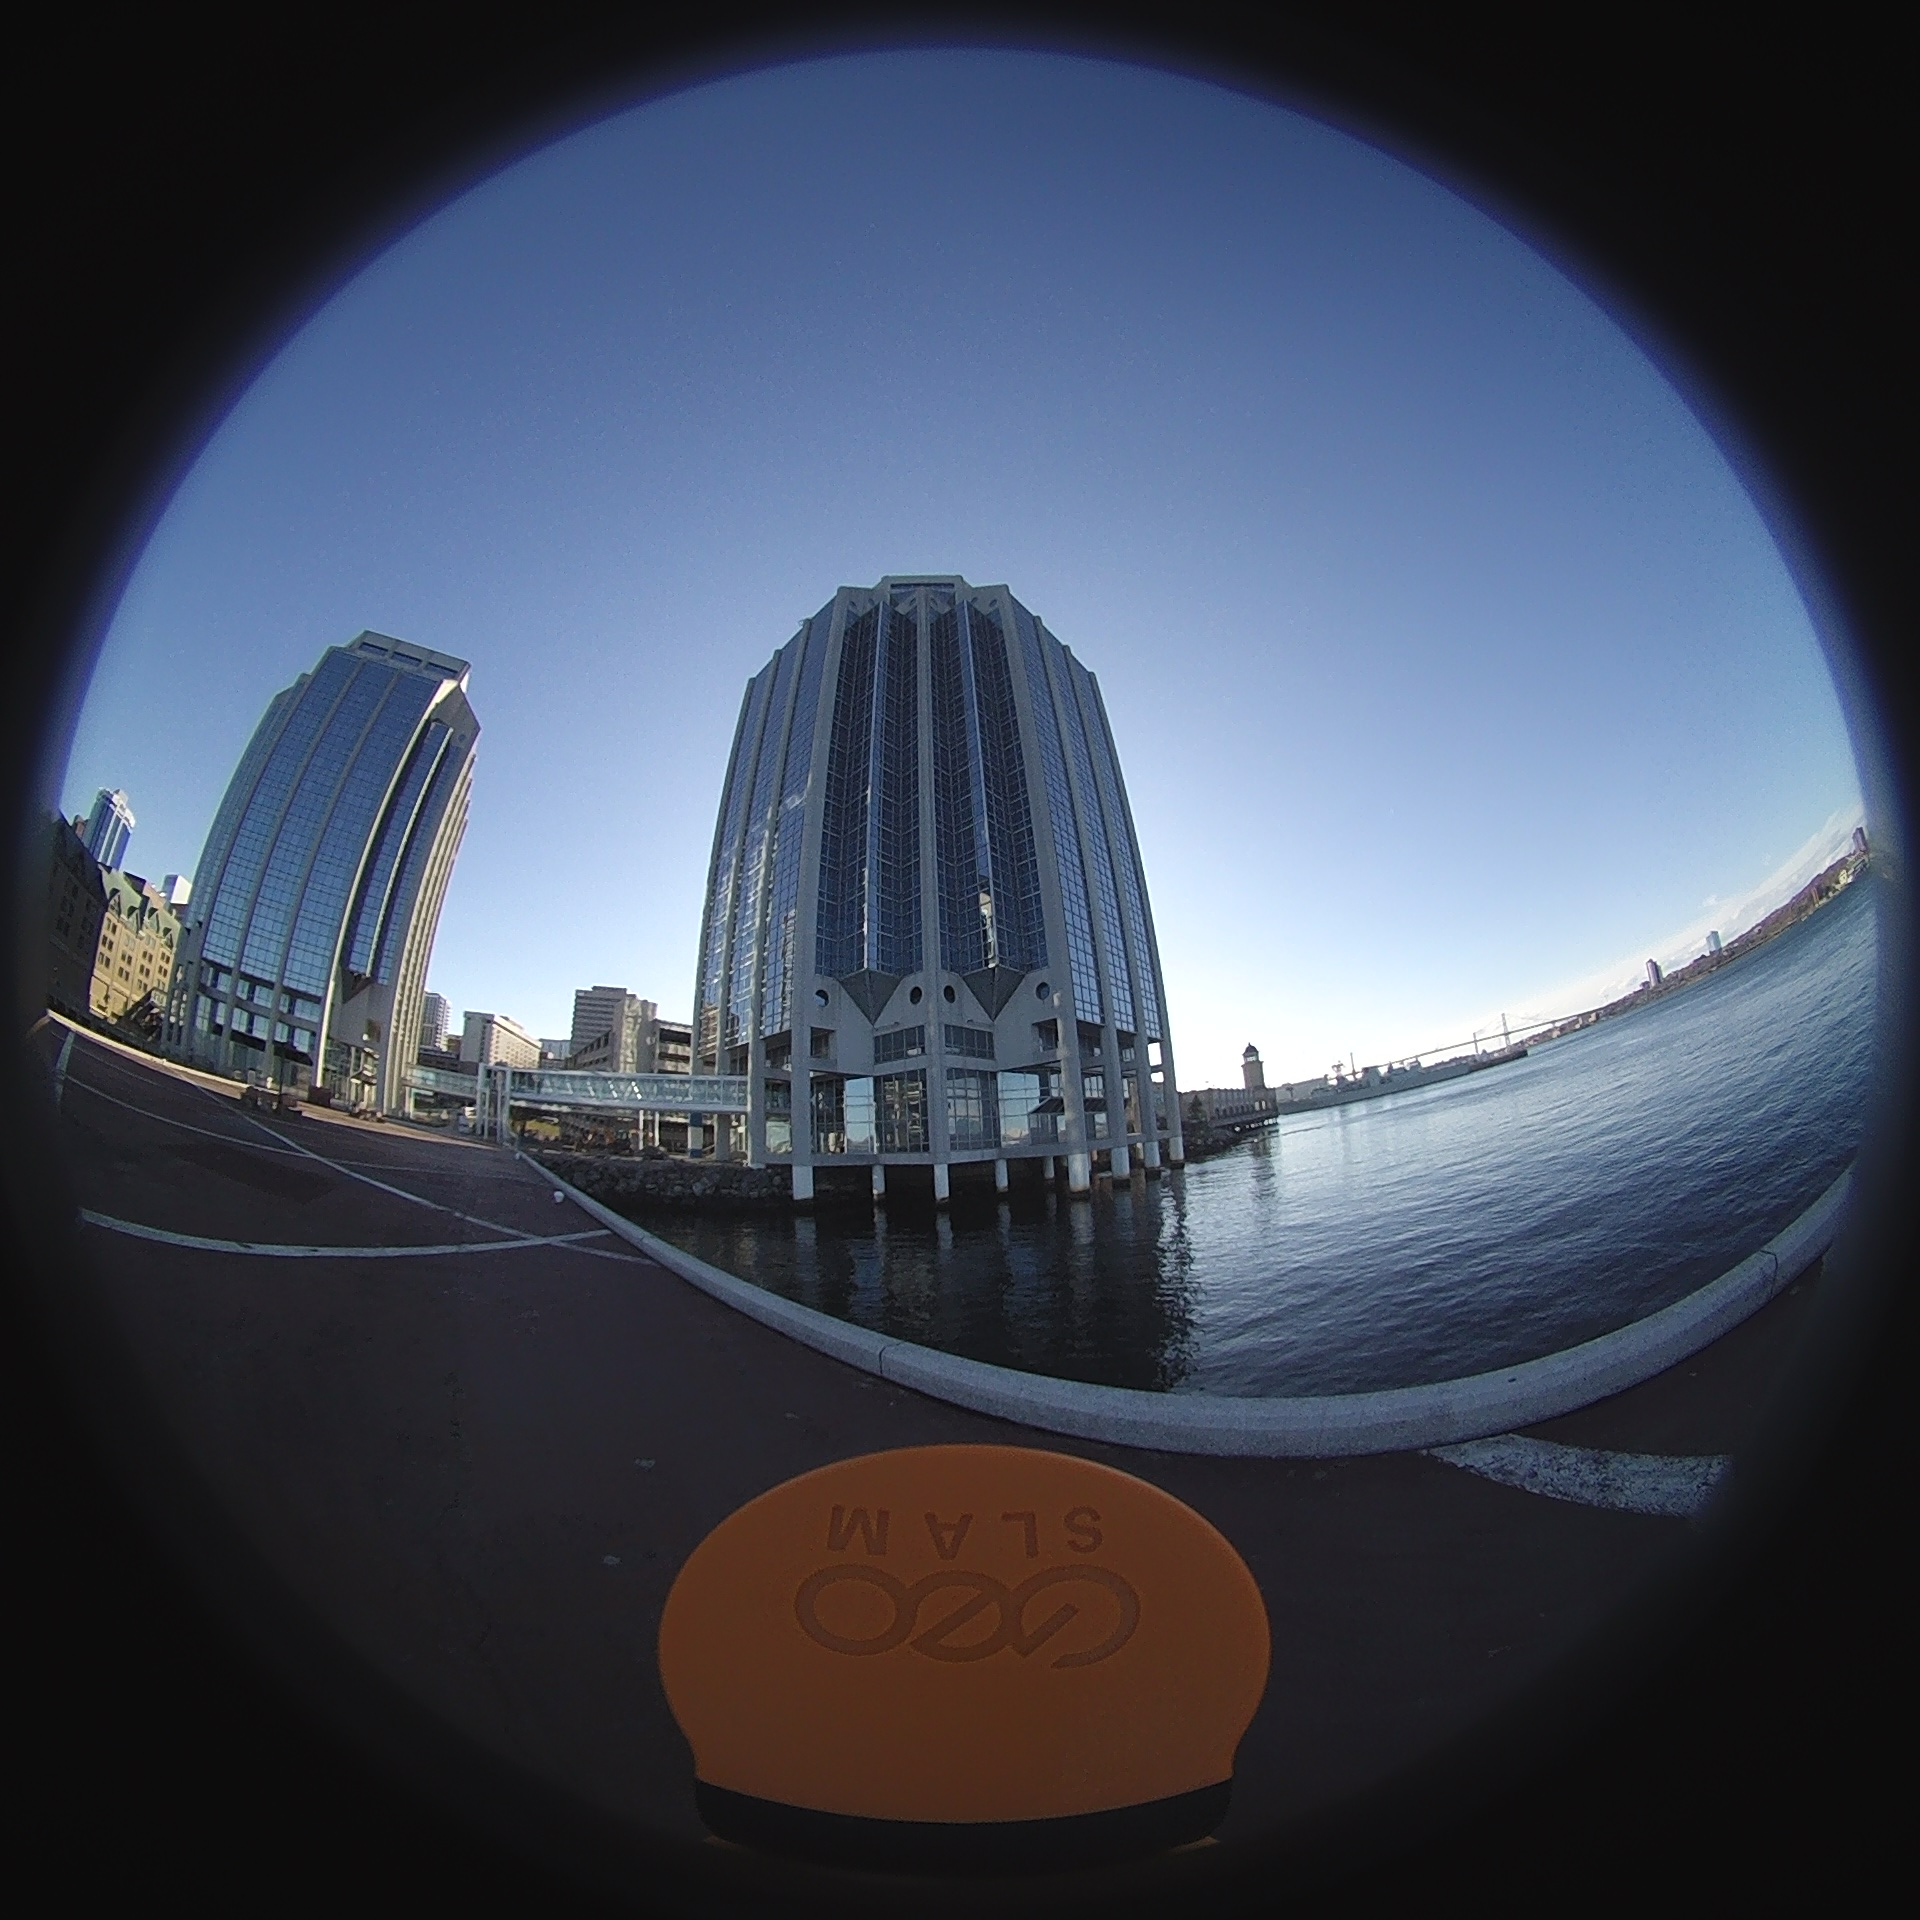
Environmental Diversity
Spring
Summer
Fall
Winter
Daytime
Night
ZEB Horizon Scanner View
Winter
Fall
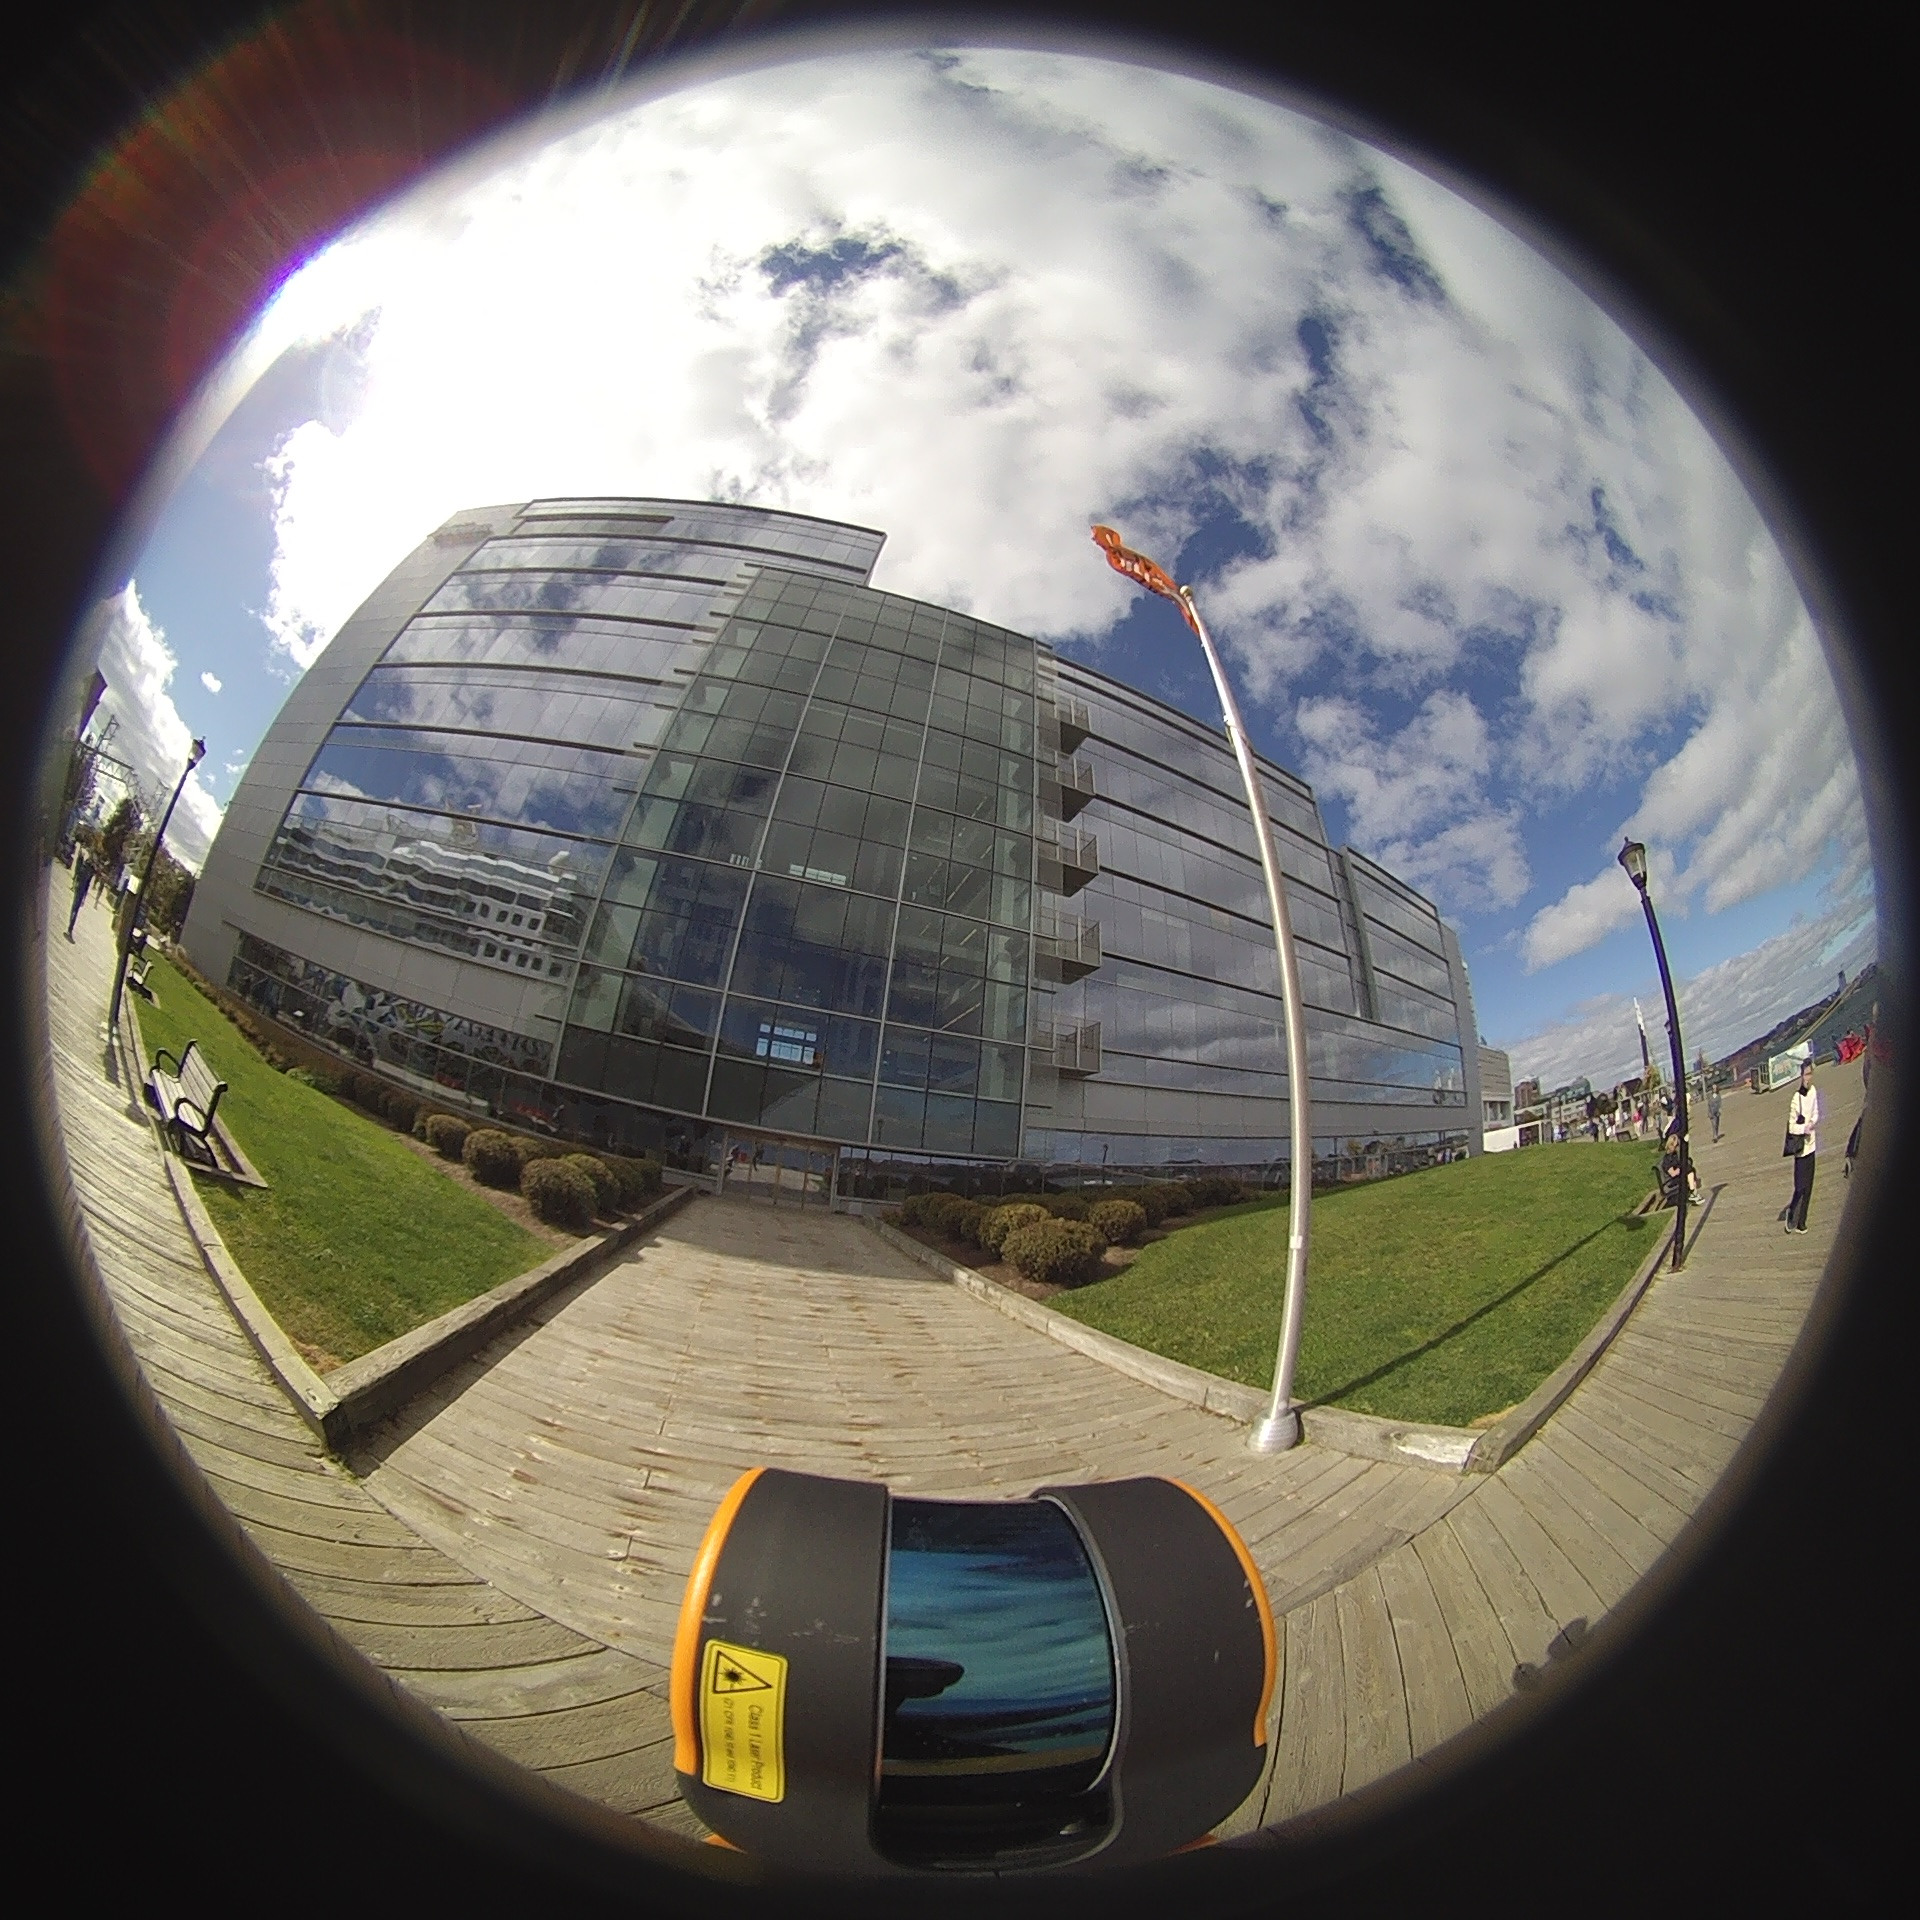
Summer
Urban
Dataset Comparison
Pts = total points (M) · Cls = semantic classes · Inst. = instance labels · Func. = functional attributes · Seas = seasons captured
| Dataset | Year | Sensor | Scenes | Pts (M) | Cls | Inst. | Func. | Seas | Facade |
|---|---|---|---|---|---|---|---|---|---|
| General outdoor / indoor benchmarks | |||||||||
| S3DIS | 2016 | RGB-D | 272 rooms | 696 | 13 | ✓ | N/A | N/A | N/A |
| Semantic3D | 2017 | TLS | ~30 | 4,000 | 8 | N/A | N/A | 1 | N/A |
| Paris-Lille-3D | 2018 | MLS | 2 km | 143 | 50 | N/A | N/A | 1 | N/A |
| Toronto-3D | 2020 | MLS | 1 km | 78 | 8 | N/A | N/A | 1 | N/A |
| SensatUrban | 2021 | UAV | 3 cities | 3,000 | 13 | N/A | N/A | 1 | N/A |
| KITTI-360 | 2022 | MLS | 73 km | N/A | 13 | ✓ | N/A | 1 | N/A |
| Façade-specific benchmarks | |||||||||
| ArCH | 2020 | TLS | 17 bldgs | 102 | 10 | N/A | N/A | N/A | ✓ |
| TUM-FAÇADE | 2022 | MLS | 14 bldgs | 118 | 17 | N/A | N/A | 1 | ✓ |
| ZAHA | 2024 | MLS | 66 bldgs | 601 | 15 | N/A | N/A | 1 | ✓ |
| City-Facade | 2026 | MLS | N/A | 200 | 9 | ✓ | N/A | N/A | ✓ |
| HFX3D (ours) | 2026 | Handheld | 26 bldgs | 492 | 12 | ✓ | ✓ | 4 | ✓ |